
Bollinger bands are very useful in the market, but, firstly, we need to understand the basics: working principles, the formula and how to use this indicator properly.
- The inventor
- The definition
- How to calculate it
- Principles of work
- Patterns
- How to build a Bollinger band
- Trading with this technical tool
- Usage Methods
- Moves within the bands
- Upper band signals
- Lower band signals
- Widening bands
- Tightening bands
- Reliability of this instrument
- Q&A
- Tools which are similar to Bollinger bands
- Limitations
- Avoiding the false signals
The inventor
In the 1980s John Bollinger, chartered financial analyst and market technician, invented Bollinger bands. It was a combination of a moving average (MA) and the statistical measure of standard deviation. This invention created an opportunity to review the volatility and stock valuation’s tendencies. J. Bollinger is also the founder of Bollinger Capital Management company and still is a very popular observer and analytical expert for the market.

The definition
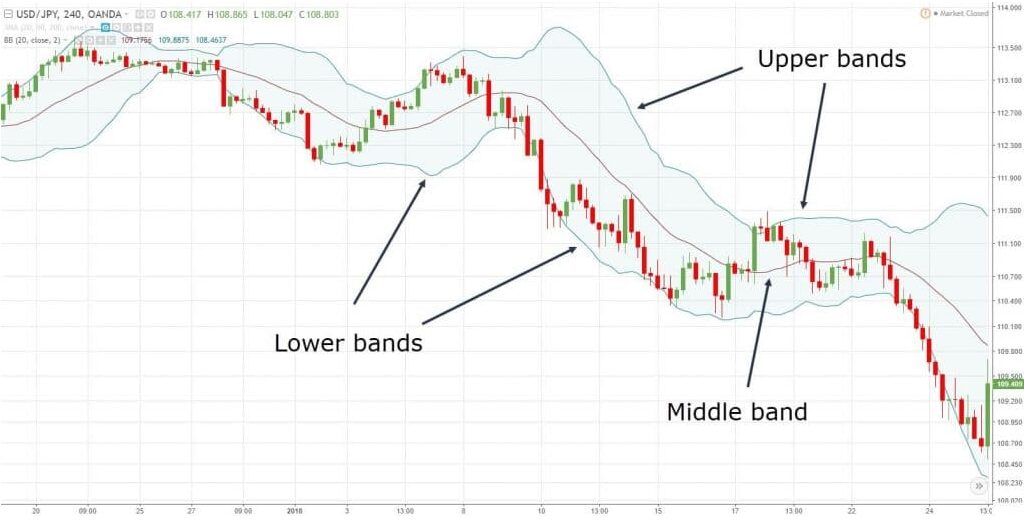
Bollinger bands are a technical tool for analysing the market. It is used for identifying the asset’s oversold/overbought condition and for measuring the volatility. Let’s review it’s structure:
- Middle line. It is a simple moving average (SMA). It indicates the average of the cost over a chosen time window. SMA usually observes the 20-day period.
- Upper level. SMA + two standard deviations.
- Lower level. SMA – two standard deviations.
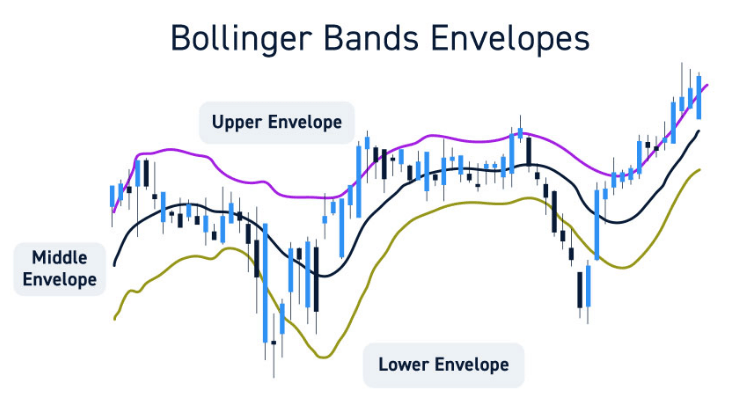
Each of them is a Bollinger band. All-together, this structure envelopes the observed valuation. Standard deviation is a key factor in their width. It follows the volatility of the cost’s changes. Usual number for the Standard deviation is 2.0. The example of common Bollinger bands on the picture.
How to calculate it
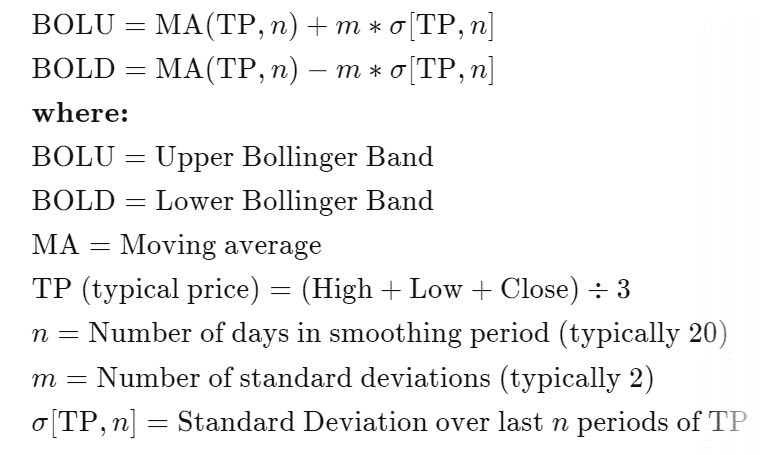
Let’s answer the reasonable question: how to calculate Bollinger bands and what formula do we use. Take a look at the calculation basis:
Principles of work
Firstly, we need to have an understanding of the indications. Let’s review them:
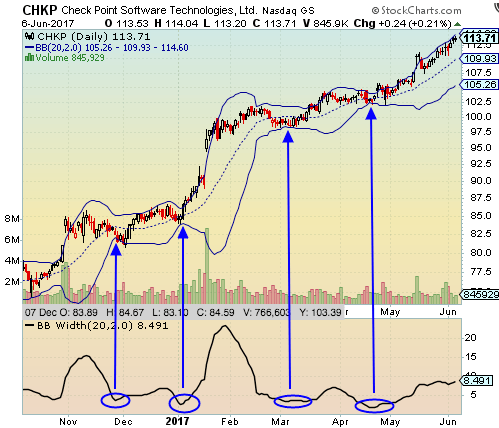
- Bands tighten within a low volatility’s period. It means the possible abrupt change of valuation. It could be the start of a trend, but you should be attentive to the false movement that is going to reverse which occurs before the actual trend. Here’s the example of such “squeeze”:
- Hugely increased the distance between the bands. It means a rise of the volatility and the possible end to the current tendency.
- Valuation bounces within the band’s borders: consistent touching of the borders from one to another. It provides you with the intel of a possible future profit target. By following such swings, you can react to such bounces to identify right entry and exit points.
- The valuation stays at the band’s borders or attempts to break out of them under the strong tendency’s influence. In this case, you need to decide between additional profit and a more conservative approach. The usage of a momentum oscillator is strongly recommended.
- A constant powerful trend which is followed by crossing the band’s borders. In this situation, you need to observe the cost and if it sharply moves back inside the envelope – it is a false alarm.
Patterns
Let’s discover two patterns of this indicator:
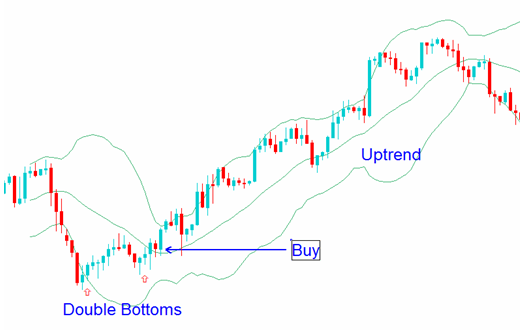
- Double bottoms. It includes an abrupt cost movement downwards with an increased volume. Also it breaks out the lower band and closes in that condition. Same action repeats in the last sequence, but with a decreased volume and stays just above the lower band. It indicates the overall downward tendency becomes weaker and buyers take the lead of this certain asset’s condition. Suggestion: play a long game with possible targets: middle or upper Bollinger band. Let’s take a look at the example below:
- Reversals. In this case, the cost breaks out of the upper band, but closes just about near the low of the interval. It is a situation of a possible trend reversal in the nearest future. In this scenario, market players take a short position with the aim for the middle line of the indicator. In the opposite situation, when it’s a breakout of the lower band and close near the high for the interval, people usually follow the long-term investing with an aim for the middle line.
How to build a Bollinger band
First of all, you need to remember that this indicator is based on an asset’s cost changes. Let’s review the sequence of building Bollinger bands:
- Learn the basics. Middle line – a 20-day SMA of the closing costs which interprets the intermediate-term trend. Upper and lower bands are situated above and below the middle line. Each of them are based on a specific number of standard deviations: 2 is a common value.
- Calculation. Learn the number of periods for SMA, standard deviation itself and its value for each upper and lower line in relation to the middle band. Settings are variable: it depends on individual features of your own strategy. Most common choice is a 20-day SMA and 2 standard deviations. Upper band: middle SMA + 2 standard deviations. Lower band: middle SMA – 2 standard deviations.
Many websites can offer you the calculation to simplify the process. The built bollinger bands will adapt the volatility changes, if they were created correctly.
Trading with this technical tool
Bollinger bands are popular with the observations for the market volatility and with determining the possible entry and exit timings. Let’s take a look at the options which this tool provides for a trader:
- Trend analysis. It is widely used to identify the trend’s stability and strength: the middle line is an indicator. If it rises: it’s an uptrend. If it decreases: it’s a downtrend. The band’s envelope width responds to the market’s volatility: wider – higher, tighter – lower.
- Identification of the overbought/oversold condition of the asset. Touches and attempts to break out of the upper line – overbought. In the case of the lower band, such events mean an oversold condition.
- Discovery of the cost targets. After a bounce from the lower line the valuation rises to the upper band which becomes a desirable exit point in case of reversals. And bounces from the upper bands, the following downward movement to the lower line means that the lower border is a target level in case of the reversal.
- Bollinger bounce trading. It is a strategy which is based on the confidence of valuation’s return to the middle SMA. Trading decision is based on the type band which the price bounces off.
Usage Methods
Let’s describe the price condition which is observed by Bollinger bands.
Moves within the bands
Two standard deviations are used to measure the difference of the cost in comparison to the middle line, SMA which stands for the intermediate-term trend. Upper and lower bands are the borders for the price movements and contain almost 95% of these changes of the observable time period.
It increases the efficiency of Bollinger bands. Let’s have a look at the moving within the bands:
Attempts to break out upper and lower levels means that the asset’s valuation in trades reached its high or low in relation to the recent valuation history. It also means a possible overbought/oversold condition. Despite that fact, cost can stay out of these boundaries for long time periods in case of strong trend.
Upper band signals
Let’s review the possible outcomes from variety of signals of the upper band:
- Overbought. Touching and trying to break out of the upper band.
- Increased volatility. Breaking out of the upper band.
- Indication of a strong upward trend. Repetitive crossing over the upper line and staying above this level.
- The price breakout. Increased trading volume with a start of indicator’s values rising can result in a potential new trend.
Lower band signals
Now we take a look at the lower band signals:
- Oversold. Touching and attempting to break out of the lower line.
- Increased volatility. Same as with the upper band: breaking down the lower level.
- Target for buying. A bounce from the lower band towards the middle line and higher.
- Indication of a strong downward trend. Continuous staying below the lower level.
- The cost breakdown or a start of a bearish tendency. Sharp downward movement below the lower level.
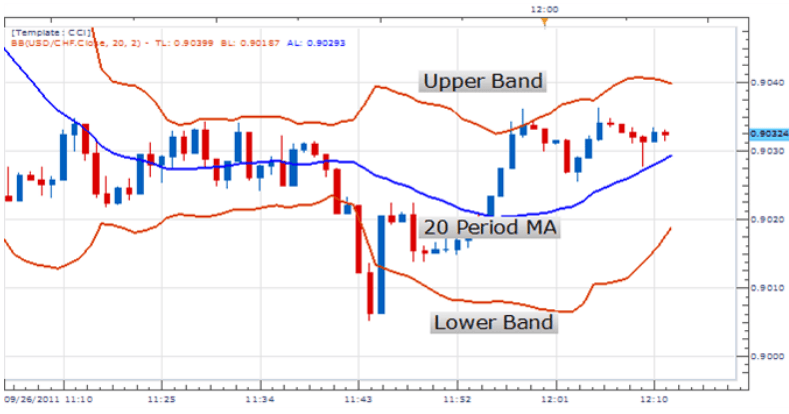
Widening bands
Let’s review all that happens during the widening bands:
- Increased volatility. Outside and inside factors: economic news or announcements, geopolitical events and e.t.c can have an impact on this.
- Strong valuation trend. Previous feature can signal the potential huge and sustainable cost trend.
- Breakout and its direction. Widening after a “squeeze” can mean the breakout. To predict the possible valuation movement direction, you should use other tools and compare the cost to them and to the bands themselves.
- Corrections of the risk management.
An instance of the widening bands:
Tightening bands
Last, but not the least: tightening bands. Let’s take a look at these indications and what they alarm about:
- Decreased volatility. The time of consolidation.
- Approaching huge valuation moves or potential breakouts. The scale of the potential breakout is measured by the time period of this “squeeze”: longer tightening makes the future breakout stronger.
- Corrections of the risk management.
- Indecisive situation about future price movements. People can’t agree on the potential cost direction until a future breakouts or new intel which impacts on the start of the possible trend.
Reliability of this instrument
There are different factors which impact on the overall reliability and efficiency of this indicator:
- Chosen asset. Each of them has its specific features, especially volatility, which directly affects the results. Sharp and unexpected movements of the asset may make things harder and stay off the indicator’s radar.
- Settings. The common choice: 20-period SMA with 2 standard deviations are set with upper and lower band. But different situations could be unfittable enough for these parameters. Basically, you need to adapt the indicator and adjust the settings to get the best possible result.
- Other tools. The quality of the result could also be improved by using other tools. All-together, they provide more intel and make a more thoughtful picture which increases chances of a better outcome.
- Random situations. It is very important that the principle of Bollinger bands work is based on the normal distribution. The market itself is very volatile: some of the changes can be unpredictable and won’t be included in this indicator.

Q&A
Tools which are similar to Bollinger bands
Of course, it is not the only market’s change indicator. MA envelopes, the Donchian channels, the average true range are similar with Bollinger bands, but each of them provides its own perspective.
Limitations
There are several limitations:
- being a lagging indicator, meaning that it only informs you about the changes;
- generating false signals at the time of highly volatile market periods;
- common settings of the indicator are not versatile for different conditions;
- necessity of using other tools to have a right understanding.
Avoiding the false signals
Checking the signal with other indicators will significantly improve trading decisions. For instance, RSI or MACD can confirm the overbought/oversold condition if the cost breaks out the band.
Secondly, volume indicators working with the Bollinger bands together can measure and confirm the strength of an occurred valuation change. Moreover, you can adapt the parameter by increasing the period of the MA and the number of standard deviations. It could help with less important and weak cost changes which will reduce a quantity of possible false alarms.
