Candlestick pattern is an instrument, which gathers information for several time fragments into one valuation level. Its usage is much more efficient than basic options. It creates a view on the potential valuation changes. In addition, right color editing opens a more close and deep look at the state of an asset.
- Candlestick Patterns’s creation
- Parts of one chart
- Body of the chart
- Upper & lower shadows
- Looking through the Candlestick Patterns
- Foreign Exchange(FX) & other market’s Candlestick Patterns
- Candlestick Pattern’s variations
- Doji and Spinning top
- Bullish & bearish lines
- The Hammer
- The Hanging man
- The Abandoned baby top/bottom
- Marubozu
- Candlestick Patterns with other instruments
- The best Candlestick Patterns and the way you use them
- Effective usage of Candlestick Patterns in the market
- Experts about Candlestick Patterns
- Misleadings and mistakes with Candlestick Patterns
- FAQ
- The most dependable Candlestick Pattern
- Are Candlestick Patterns good enough to use
- Candlestick Pattern’s reading
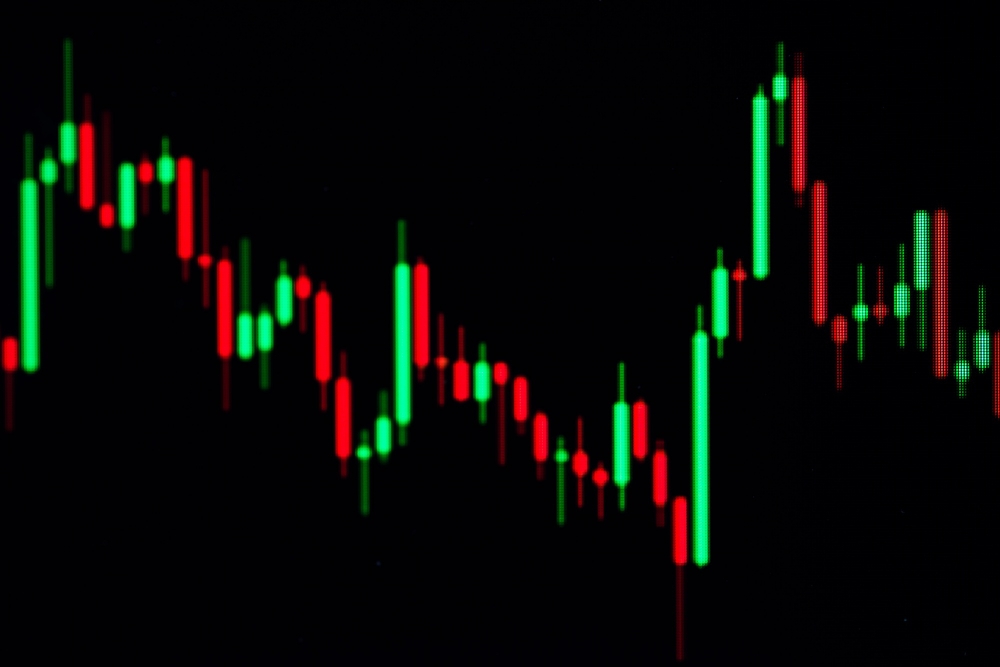
It is usually being used on a 24-hour window. Every part of the chart gathers all the information about an asset of a single day. With such usage, Candlestick Patterns are a better instrument for longer-term or swing market players.
To speak about color, every Candlestick Pattern’s single chart shows the result of buyers and sellers competition. If it is green or white, for example, the buyers are winners. That’s the light candle. And on the opposite side, if it is red or black, the sellers are the ones who win. That’s the dark candle.
The most interesting part of Candlestick Patterns are about what happens in this rivalry throughout the whole day.
Candlestick Patterns’s creation
Let us have a look at Candlestick Patterns’s formation. First of all, we need to know the inner side of this instrument.
Parts of one chart
A single chart for a one time frame is divided to 4 parts:
- The open price (O) – starting cost of an asset.
- The close price (C) – ending valuation of an asset.
- The high price (H) – the biggest cost of an asset.
- The low price (L) – the cheapest valuation of an asset.
Body of the chart
Body of the chart is a space between the start and end of trading. There are two ways of valuation changes: bullish and bearish. Each one is marked with a different color. Green color is the indicator of the bullish movement, which means that cost is lower in the end. Red color shows that the bearish movement wins. It means a higher cost at the end of the day. Body’s size indicates the direction of movement, which gives an understanding of the dominant type of trading with the specific asset: bullish or bearish.
Upper & lower shadows
Let’s have a look at the other important part of Candlestick Pattern – shadow. There are two types of shadows:
- The upper shadow – a border line between the highest point of a body and the trading period peak.
- The lower shadow – another border line, but in this case, between the lowest point of a body and low trading period.
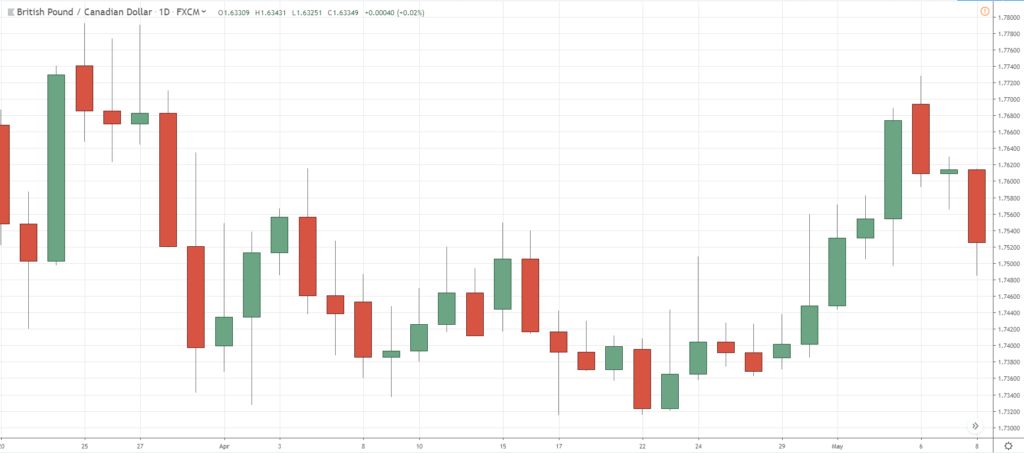
Most important knowledge you get from it is about their length and location:
- About the upper shadow: if it is long, it means that the valuation was rising, but at some point it faced a severe amount of selling or profit-taking close to the highest cost point. This event can start resistance lines or bearish behavior in connection with the observed asset.
- The exact opposite happens, if it is short. That means the buyers prevail which leads us to conclusion: bullish behavior is the answer.
Looking through the Candlestick Patterns
One candlestick for a 24-hour period consists of 4 stages of market’ state which are (OHLC) valuations. The view model looks like a rectangle. It is colored with red or black for a lowering of the valuation and green or white for a cost rising. The levels higher and lower than its body are called shadows or wicks. They show the highest and lowest daily points of valuation. Keep all that in mind and use it to obtain a significant amount of knowledge of potential movement of the asset’s cost. Overall information should be verified with the next 24-hour period candlestick.
Foreign Exchange(FX) & other market’s Candlestick Patterns
FX’s Candlestick Pattern functions on a daily schedule. It leads to the end of one candlestick to be the start of the next 24-hour period candlestick. It reduces the difference in the valuation gradation in FX charts. It has only one time frame to be a changing factor. Saturday and Sunday are not in the list of observations in this case. All-in-all, you will see the differences between the end of Friday and the beginning of Monday.
Most of it depends on valuation differences as an inherent part of the indication. Those differences are marked in all situations. On the other side of the story, FX candles are based on the trader’s mind. You need to point out the signs by yourself, which is not the usual way to use this indicator. The situation is in your own hands and you need to be patient and smart about the FX candle.
Candlestick Pattern’s variations
Doji and Spinning top
Doji – a very small candlestick, which represents the equality between open and close valuation. It is viewed by a thin line. Doji shows a close fight between buyers and sellers. Cost can move upwards and downwards for a few movements, but it sticks to the open cost. This candlestick is an indicator of a draw between buyers and sellers.
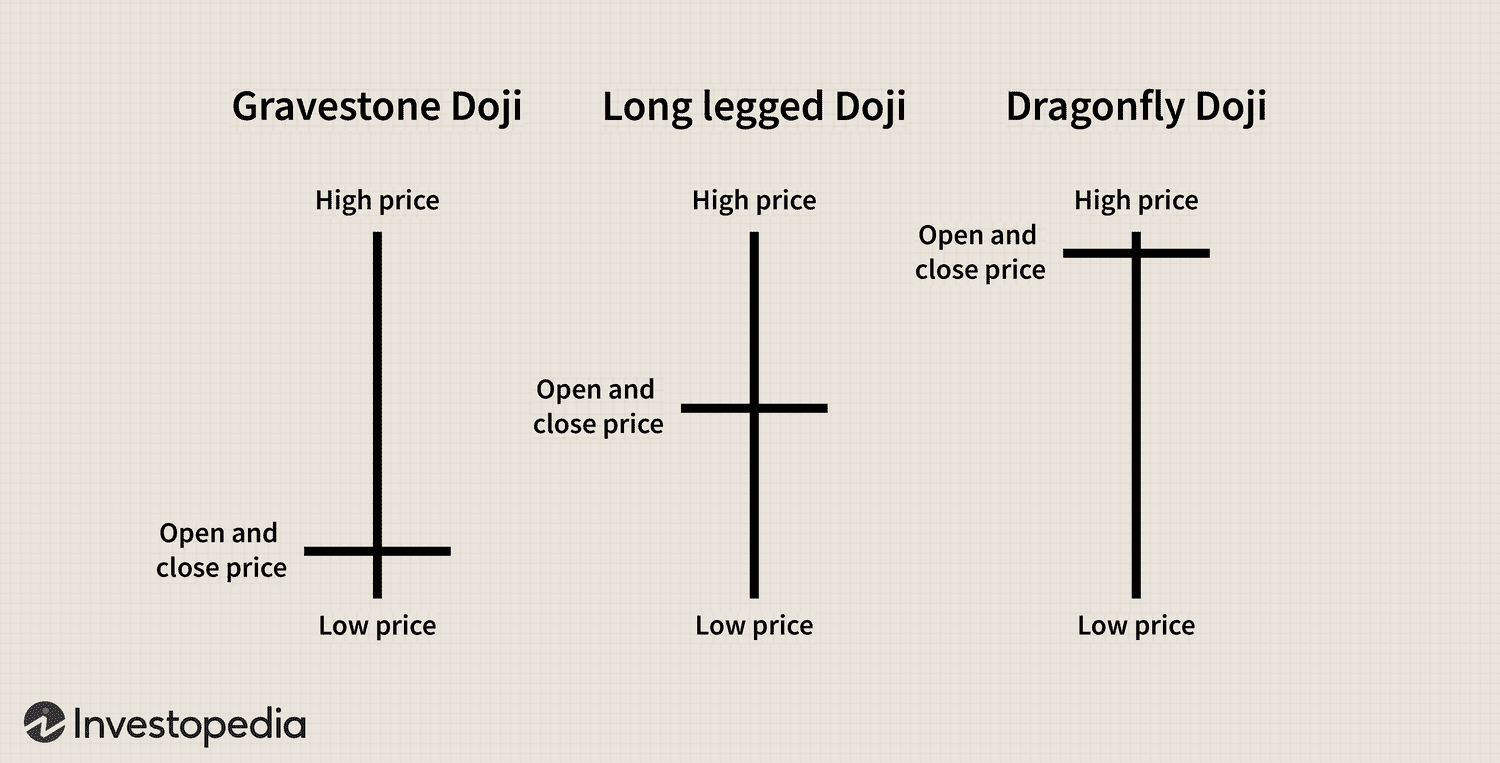
There are 4 types of Doji’s candlesticks:
- Long-legged.
- Dragonfly.
- Gravestone.
- Four price.
Doji also shows the timings of a short-period time window, which shows the weakness of each side of the market. You need to take the moment and decide, which decision will follow the market change by depending on the current state of buyers and sellers struggle.
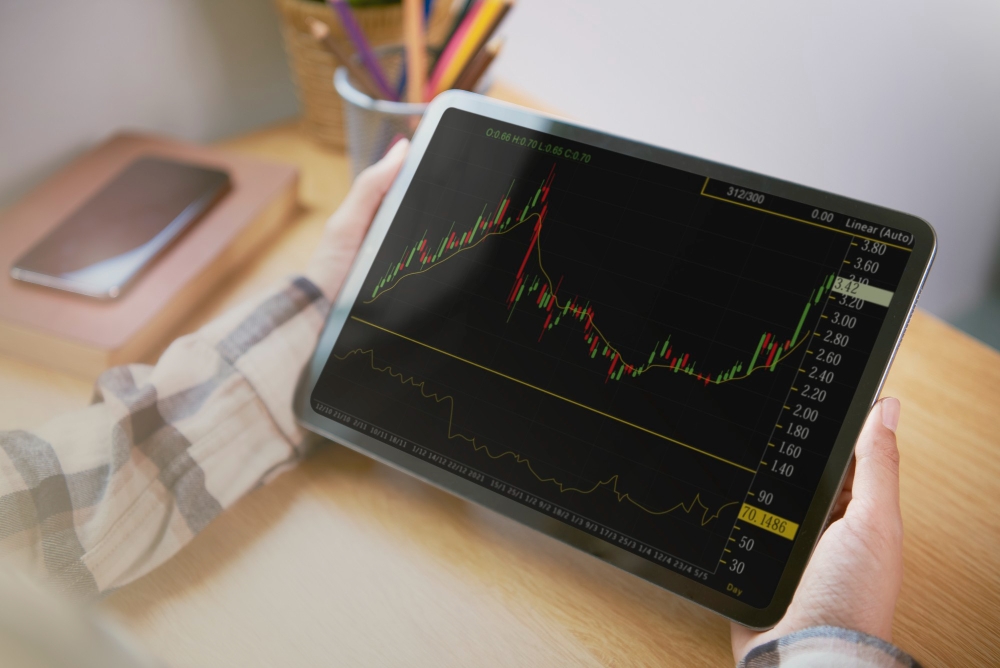
The spinning top – candlestick with long upper and lower shadows and small bodies. It also shows the struggle between buyers and sellers. Same story happens with the movement – it’s gathered around the same level of valuation. There are two possible outcomes in a spinning top:
- In uptrend: when sellers gain a small window of control in changes of valuation, because of buyers reduction, it can lead to a reversal of cost movement direction.
- In downtrend: when buyers gain a small window of control in valuation changes. It’s quite the opposite, because the asset loses its sellers and buyers can start a reversal movement in cost.
Bullish & bearish lines
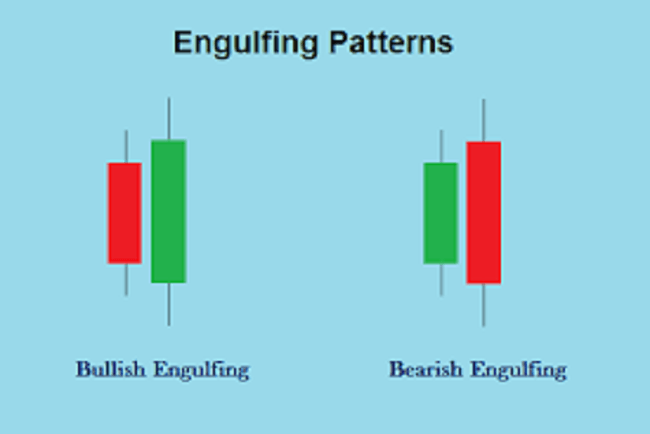
These are also known as Engulfing Candlestick Patterns. As you can discover, it has two types:
- The bullish engulfing pattern – two candlestick reversal model which is usually followed by a huge valuation rising. It occurs when a bullish Candlestick Pattern is right after bearish Candlestick model. It means the buyer’s domination of the cost changes.
- The bearish engulfing pattern – two candlestick reversal model which is usually followed by significant cost downfall. It happens when a bearish Candlestick Pattern is right after a bullish Candlestick model. It is the opposite side of valuation change. Sellers regain full control over the cost.
The Hammer
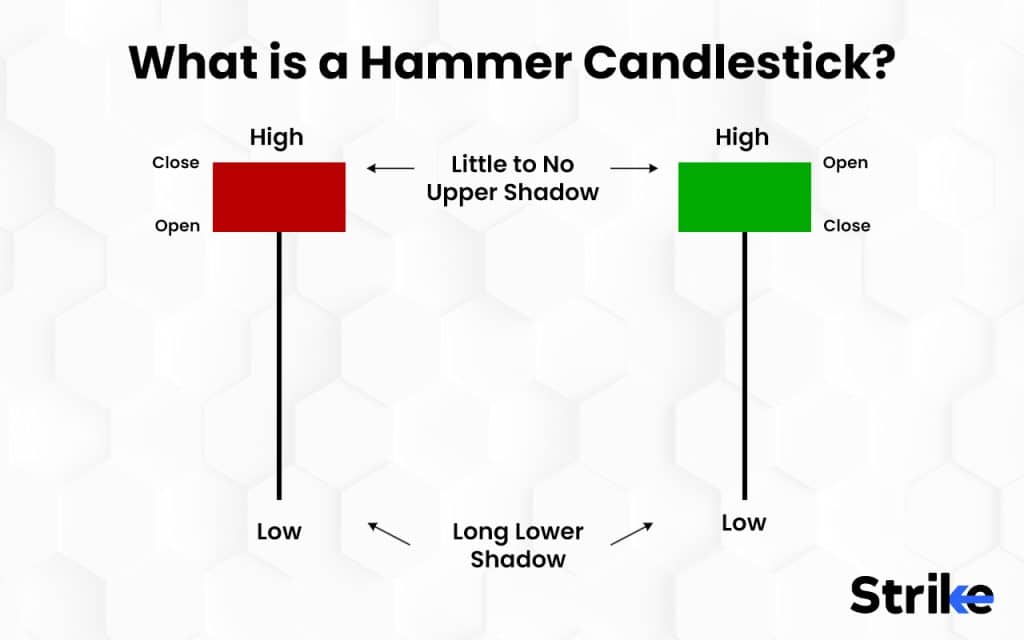
A bullish reversal model that occurs in a downtrend is the hammer. It indicates the lowest point of the valuation’s downfall and the future rising. The long lower wick shows the buyer’s strong resistance to the seller’s domination. You need to be sure about the point of reversal, so keep your observation for further confirmations.
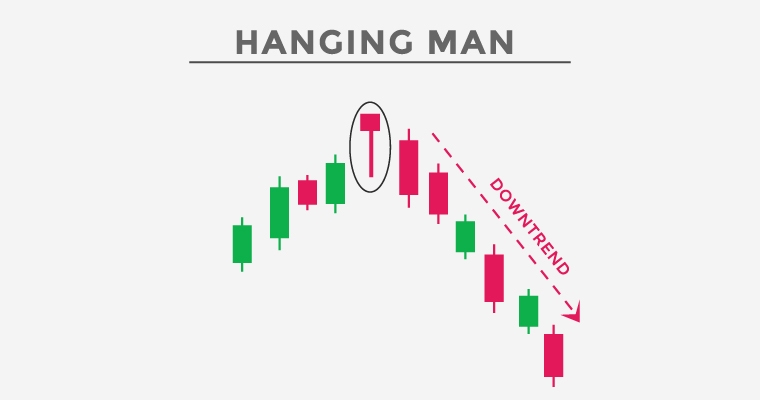
The Hanging man
A bearish reversal model that occurs in an uptrend is the hanging man. It is the opposite side of the fight in the market. It indicates the highest point of the valuation and the future cost’s dropping. That’s the constant resistance of sellers to the buyer’s dominance. In that case a long lower wick shows the seller’s prevailing over the cost. In the further time frame the valuation will decrease under the seller’s influence.
The Abandoned baby top/bottom
Candlestick Pattern, which is followed by a main reversal in the lead direction of valuation’s changes is the abandoned baby. Its other name is an island reversal. The top is created after rising and the bottom is created after decreasing.
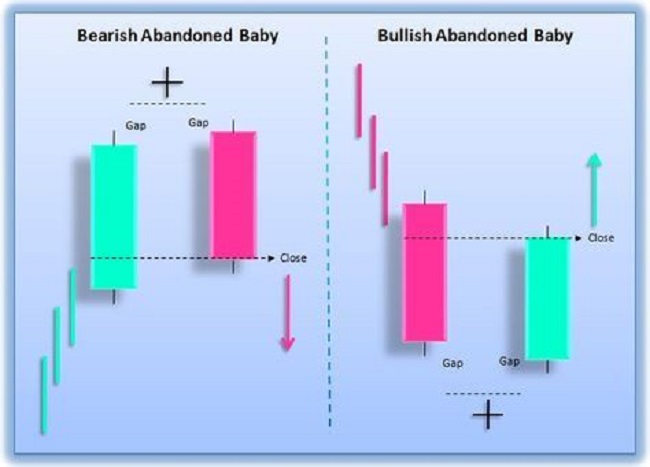
It has a small body, which is caused by a gap in the direction of the prevailing trend. The next 24-hour time frame is a verification. A gap becomes lower/higher, which indicates that the main gap higher is destroyed and the selling/buying interest becomes the prevailing one at that time frame on the market. Verification is viewed by a long and dark candle in the following 24-hour time period.
Marubozu
Bullish & bearish lines are also known as a Marubozu candlestick. These are two variations of Marubozu:
- White Marubozu (WM) – candlestick with a long white body with no shadows. The pattern verified by the equality between open and low valuation & between close and high cost. This Candlestick Pattern shows that buyers were in charge of the entire time frame. That’s the bullish line. It usually happens at the start of the bullish reversal model or as a continuation of a bullish pattern.
- Black Marubozu (BM) – candlestick with a long black body with no shadows. The pattern verified by the equality between open and high & close and low. This Candlestick Pattern shows the opposite side of the story: sellers were in charge of the chosen time frame. That’s the bearish line. It usually happens at the start of the bearish reversal model or as a continuation of a bearish pattern.
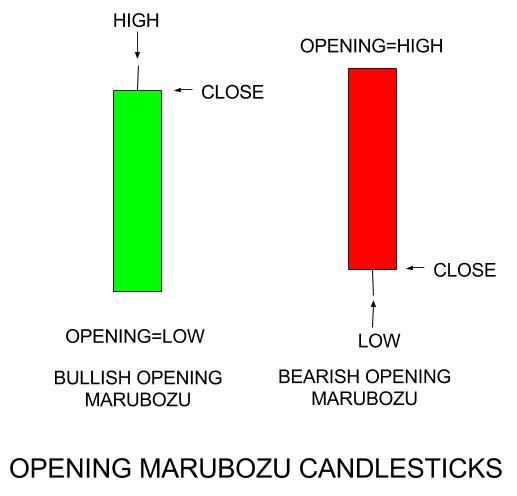
And a piece of advice ahead: WM at the end of an uptrend is usually being followed by a continuation; WM at the end of a downtread is usually being followed by a reversal. On the other hand, BM at the end of an uptrend is usually being followed by a reversal, and BM at the end of an uptrend is usually being followed by a continuation.
Candlestick Patterns with other instruments
Let’s have a look at the example of using Candlestick Patterns with support and resistance. You can see the potential connection between them by analyzing the statistics. Candlesticks are one of most sufficient indicators, which are led by support and resistance throughout the market. The usage of Candlestick Patterns will help to get the necessary knowledge about timings of valuation changes. You get the support and resistance signs and wait for a Candlestick Pattern to confirm the next flip in the cost.

These indicators are much more useful together, because they complete each other. This alliance provides you a wider picture of the current valuation’s state, which gives you the potential advantage in future trades.
The best Candlestick Patterns and the way you use them
Let’s review Candlestick Patterns and the most efficient way of its usage:
- The hammer: look for bullish/bearish reversal models and use these time frames to buy/sell the asset. Each side is on the exact opposite position on the valuation scale: bottom & top. Viewing model of the hammer has a small body, a long lower shadow and no upper shadow.
- The pin bar (PB): it’s an indicator of support and resistance, trendlines and moving averages. It has a small body with a long lower wick and a short upper wick (bullish PB); a long upper wick, small body and short lower wick (bearish PB). Bullish PB gives you a sign to sell an asset and Bearish PB gives you the other sign to buy an asset.
- The engulfing candlestick pattern: the bullish Candlestick model is indicated by the first candlestick being red and the second being green. Green’s body is much bigger than the red’s one, with very small to no overlapping wicks. It shows that buyers regain the domination of the market at this time frame and it’s a good time to buy an asset. The Bearish Engulfing Candlestick Pattern is the opposite side. Green is the first, small candlestick and Red is the following one and it’s much larger. It’s the signal to sell an asset because sellers regained control over the valuation change.
- The hanging man: it is a bearish sign, which happens after an uptrend. It is followed by bullish movement slowing down or reversing. The hanging man has a small body, which is on the peak of the candle, with a long lower wick. The lower wick is twice the length of the body. After this indication, you should buy. The valuation will be profitable.
- Doji: it is the sign that buyers and sellers are equal in asset’s valuation changes. Its wicks are variative. This Candlestick Pattern shows the necessity of being patient. You need to be certain of your next move because of constant wobbling in price. All-in-all, doji works like a stop sign.
- Marubozu: Candlestick Pattern with no wicks and a long body. It has two types: White and Black, depending on color. White Marubozu indicates the domination of buyers throughout the whole time frame, which is a good call to wait for reversal and sell the position at the reversal point. Black Marubozu is about the opposite: sellers are in charge, so, wait for the right time window. At the end of day, you can buy an asset at lower valuations in the end of the selling tendency.
Effective usage of Candlestick Patterns in the market
The most efficient way to use Candlestick Pattern is in a 24–hour window. It gives you a good enough understanding of current market trends. Based on it, you can adapt to the asset’s changing tendency and interact with the market in more profitable ways. There is no such thing as a perfect condition for a Candlestick Pattern, but keep in mind that it is used often in a lone-wolf form without any other indicators. Of course, you can adapt it with support and resistance to improve the quality, but each of them is not always connected to the same time frame.
Experts about Candlestick Patterns
Steven Nison integrated Candlestick Patterns into the West. He marked the fact that it is great in revealing the main tendency: bullish and bearish rivalry and their equality at some point. It shows the psychological side of trading and the real-time picture of the situation. He clarified that traders should be attentive enough to identify the start of a reversal. This would help to have the best trading pattern to yourself.

John J. Murphy has his own thoughts about Candlestick Patterns. As an expert in technical analysis, Murphy says that it can and should be used with other market indicators. He insists on a symbiosis between Candlestick Patterns and other indicators to have a best possible prediction in a future market tendency. Murphy thinks that it would create a more strong and dependable structure, which you can use afterwards to have the best trading pattern.
Misleadings and mistakes with Candlestick Patterns
There are several based mistakes with Candlestick Patterns:
- Not every Candlestick Pattern has a necessary amount of right information: support and resistance are quite useful if you have a blurry view on a current market situation with it.
- Try not to overthink about the deep meanings of the Candlestick Patterns. There is a very small chance that you find something if you dig into it far deeper than you should. Overlook for the tendency throughout the market and make a move, when all the evidence is enough to create a trading decision.
- Candlestick Patterns do not always go by the same model. Keep in mind that, for example, the four candles pattern may end by being the five candles pattern. There are different situations and it would be strange if the whole thing goes exactly by the model. Be aware of that.
- Don’t focus on exactly one model. Be sure to check the whole market to have a best understanding of the situation. It will give you the best view model of the possible outcomes in the future.
- It is not always self-confirming, you should keep that in mind. Be sure to wait for the whole pattern formation to have the right expectations of future valuation changes.
FAQ
The most dependable Candlestick Pattern
Candlestick Pattern quality is connected with the market situation. It’s pretty obvious that it won’t give the 100% guarantee. All-In-All, Engulfing is identified as the most dependable Candlestick model.
Are Candlestick Patterns good enough to use
The short answer is yes. Its efficiency has been proven enough. But the result fully depends on the human factor and time periods. Be sure to acknowledge the right confirmations and use it to have a best trading opportunity.
Candlestick Pattern’s reading
Look throughout the 24-hour periods in Candlestick Patterns, check the color, which give you the information about the current tendency: black or red for the valuation dropping and green or white for the valuation rising. Be aware of candlestick’s wick which gives you the information about peaks and bottoms of the price of an asset.
