


It’s crucial to understand the signals of possible changes in the market. In case of the correction, it is very important. Let’s define the process and gather all the necessary knowledge for better trading decisions during it.
- Actual meaning of Market Correction
- Reasons behind & influence
- Necessary decisions at the time of Market Correction
- Initial Causes
- Different variants
- Ways to discover the correction
- Instances
- Chart Analysis as an indicator
- Wave Analysis perspective on the Market Correction
- Benefits & Drawbacks
- FAQ
- Market Correction vs Market Crash
- Necessary business preparations
- Duration of the common Market Correction
- Strategies to execute at the time of Market Correction
Actual meaning of Market Correction
If the cost or volatility of an asset drastically increases there is a certain pattern to control such growth: downward trend. This process of decreasing is called market correction. This action continues to interfere with other markets which provide people with a short time window of unpredictability of the asset. Take a look at the visual representation of the common correction:
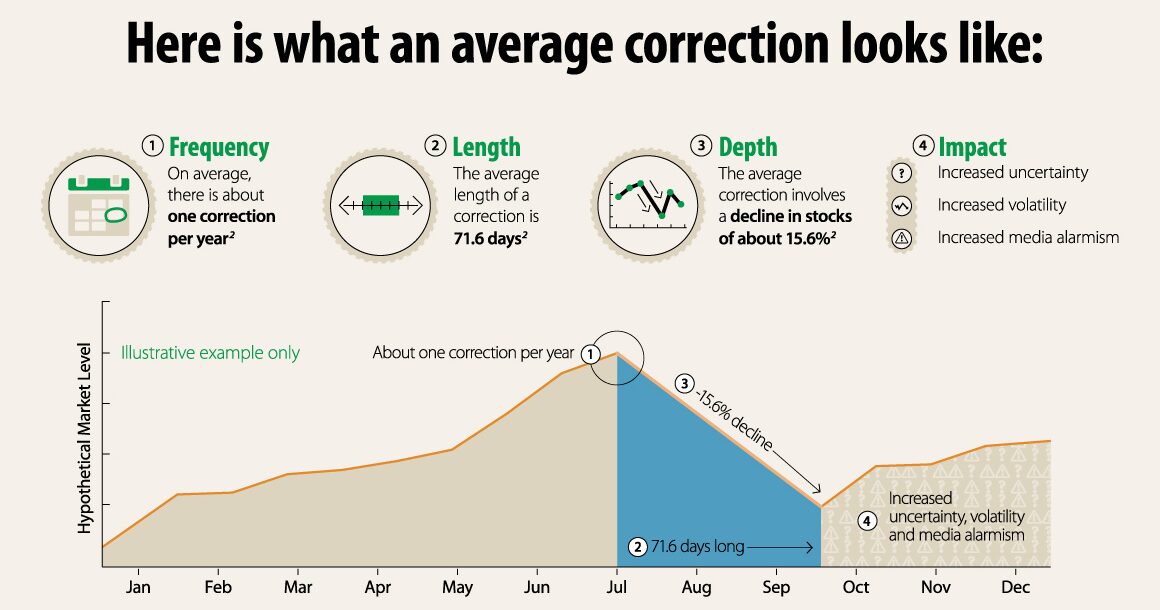
Such an event gives market players time to reconsider their decisions and adjust the strategy to the market sentiment change. It can abruptly or gradually occur. Target and result of this process will be indeed the same – downward movement of the asset’s valuation.
Reasons behind & influence
There are several reasons behind a market correction:
- Growth of interest rates.
- Changes within the law.
- Economic recessions.
- Investor sentiment changes.
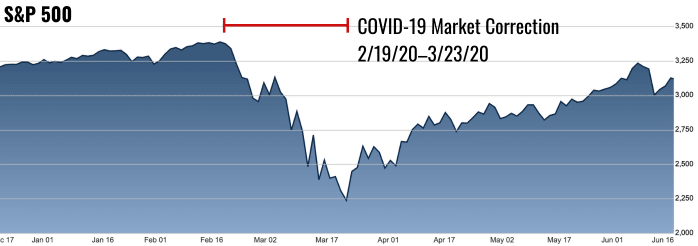
- Possible external interference to the market. Here’s the example of a significant impact on the market by the COVID-19:
Such events end up in a market correction which is followed by the readjustment: businesses and market players review their portfolio, risk management and the strategy itself. Investors, for example, hold down their horses and play more carefully to protect their portfolio. On the other hand, businesses commonly scale back their planned moves.
Necessary decisions at the time of Market Correction
To protect the business from losses during a market correction you should follow several steps:
- Reduction of expenses.
- Reserve and store cash.
- Evaluate existing investments due to the changes.
- Take a closer look at competitor’s decisions and activities.
- Observe the market activity and prepare for possible regulation changes.
Initial Causes
The valuation decrease is commonly expected due to several specific causes:
- Investor doubts and concerns. For instance, the fear of the potential inflation rate’s growth can be followed by the increasing key rates by the Central Bank. It can lead to an outflow of funds from the stock market.
- Macroeconomic indicators reduce the momentum of economic growth.
- Political or military events.
- Speculating strategies in trading & algorithmic trading. For instance, HFT trading which lately became especially popular. However, several analysts think that algorithmic trading strategy can lead to the abrupt market downfall if robots begin to buy or sell whilst the liquidity is low and they do it at the exact same time.
- Overvalued assets.
Different variants
However, there are two variants of such events:
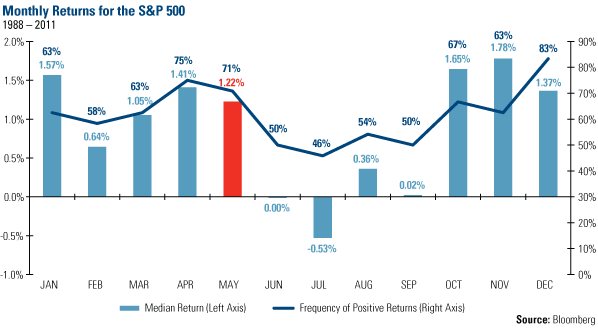
- Seasonal correction. It occurs in the stock & commodity markets and works as a pattern of specific events whilst speculative cost changes. For instance, market players reduce the action during summer on the late December holidays. In that case the valuation oftenly fluctuates abruptly which is followed by the liquidity falling.
Here’s a visual example of it:
- Technical correction. It occurs when an asset is overvalued or is impacted by important news. The duration of this correction is shorter than the seasonal one. However, it happens more often.
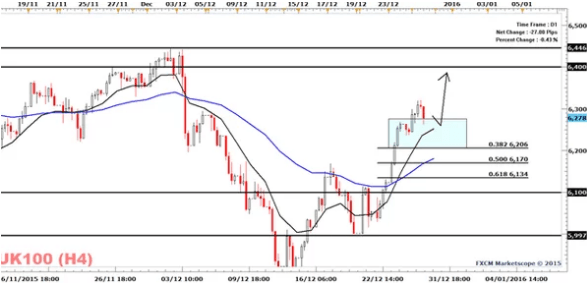
Look at the instance of the such a correction in the bullish movement:
Ways to discover the correction
There are not any sort of instruments to identify the exact pattern of the market correction. Despite that fact, market players can predict the extent of changes with specific tools:
- Fibonacci retracement levels. There are certain movements of price (slowing down or reverse) at these values: 23.6%, 38.2%, 50% and 61.8%.
- Significant support & resistance levels. Such levels can be observed through the big time frames. It stops the existing tendency. Also, the Bollinger bands assist in the indication of the correction: lows on the graph must be observed.
Instances
Let’s take a look at the example of the 2020 correction of SPY.
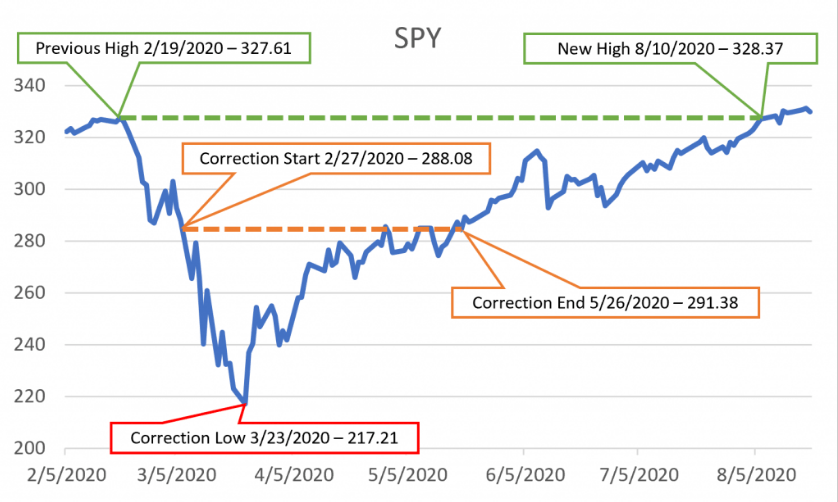
First of all, the main goal is to detect a 10% drop from all-time high levels. It is one of the prior signs that the market started the correction phase. After that we can clearly rewind the previous correction patterns and apply it to the existing one.
Statistically, the lowest cost during the correction is the low on the graph. After several price fluctuations, it will overgrow the initial high of the asset valuation – this is the mark of the correction’s ending.
However, in several cases the price can rise above the initial high multiple times during the correction period – bear that in mind.
Chart Analysis as an indicator
Chart Analysis can be used as a tool for certain observations, such as a throwback and a pullback which stand for a rollback while either of trends exists (Bullish or Bearish).

For instance, there are several signs which can help to identify the correction pattern – the ‘neck’ level, for example. It commonly appears after the other one which stands for a reversal – ‘Head and shoulders’ pattern. It will be followed then with a movement of the cost into the breakout direction.
Wave Analysis perspective on the Market Correction
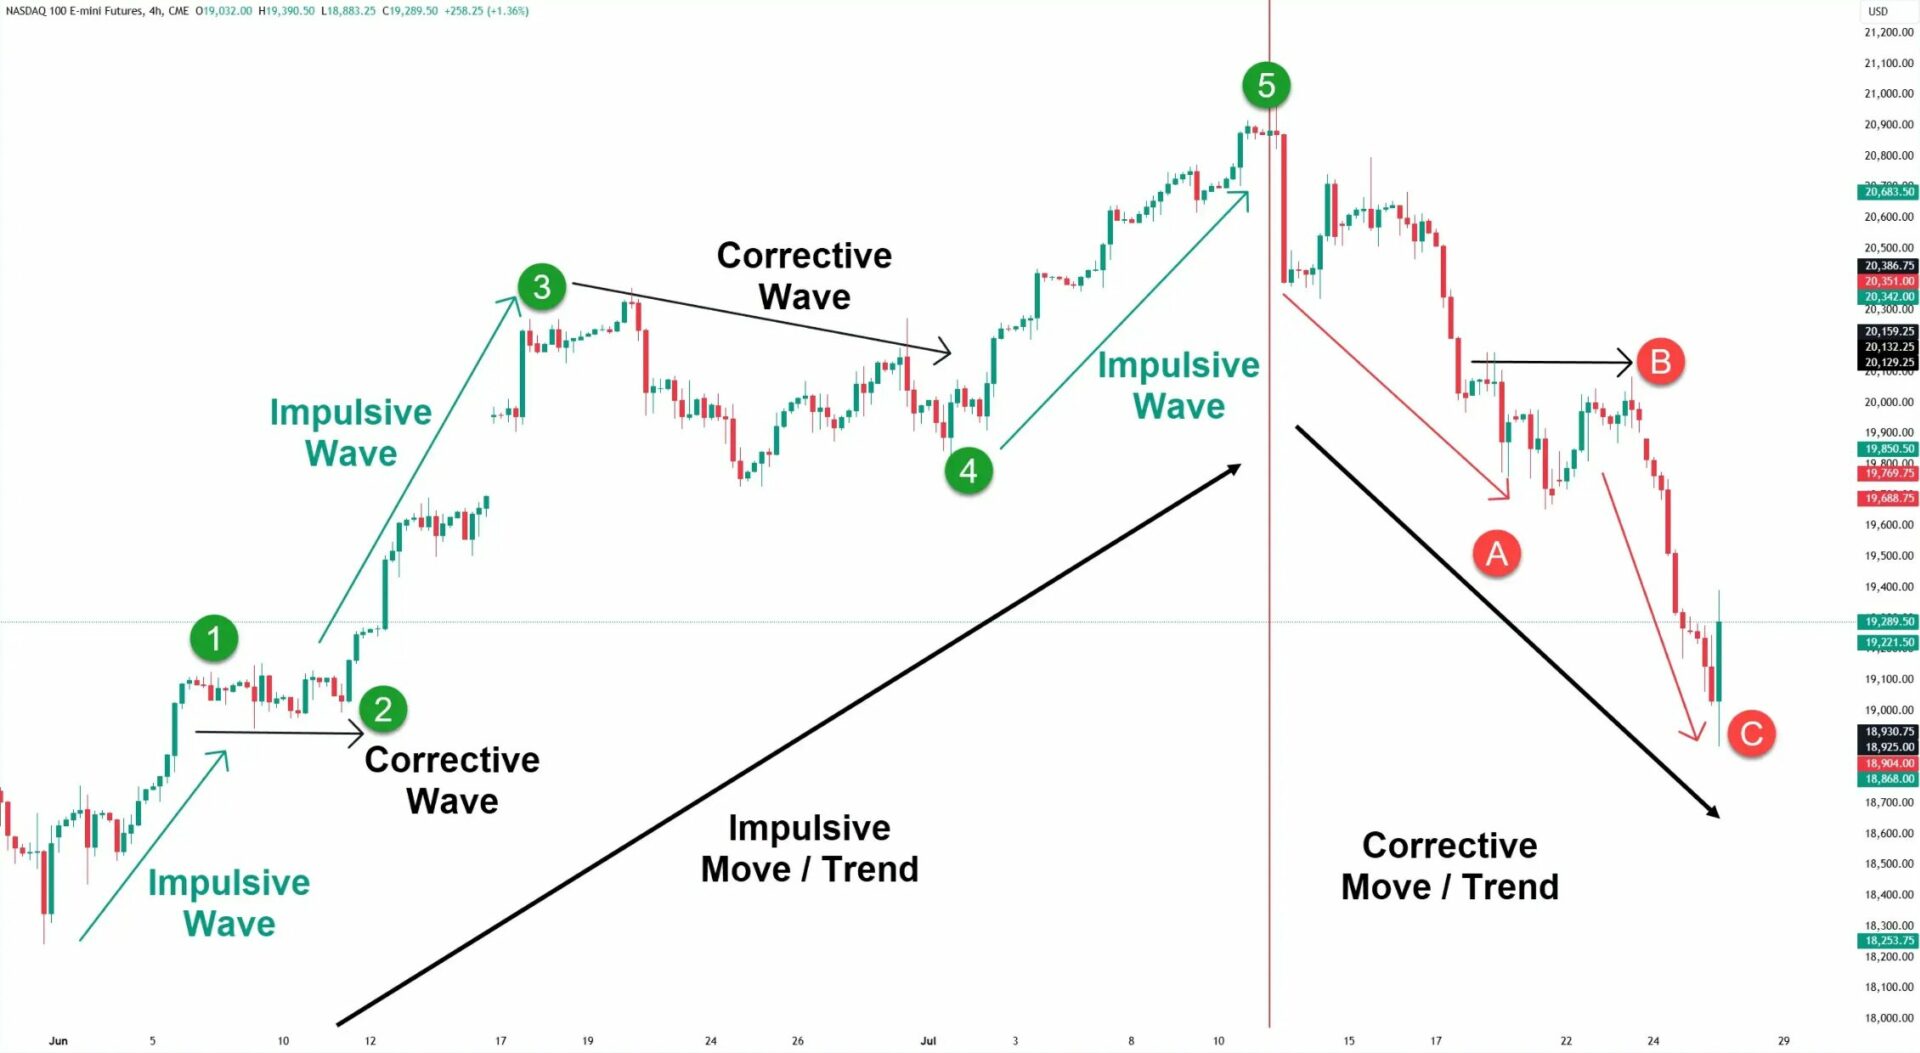
Let’s take a look at the Market Correction with help of the Wave Analysis.
It will be viewed as a part of the wave structure. Waves of this specific process will be part of the whole picture and will alternate with impulse waves.
One big difference between the usual impulse and the correction waves is their length: the common impulse one is larger than the correction wave. Their quantity is variable: from 1 up to several. Take a look at the example on the graph below:
There are two main patterns which can help you to identify the possible correction:
- Contracting triangle.
- Double flat.
In addition, if you base the strategy on a wave analysis it is best to trade an asset through a breakout.
Benefits & Drawbacks
Let’s review the positive and negative effects which can occur during the process. Firstly, the beneficial features:
- Overvaluation decreases.
- A possibility for investors to buy an asset for a lower price at the time of the process.
Now we can take a look at the possible drawbacks:
- Potential trend change.
- Human factors are quite dangerous, because people can make wrong decisions under the pressure of a misunderstanding of the correction pattern.
- Position traders lose their funds. It lead to several credit leverages.
FAQ
Market Correction vs Market Crash
Despite that each of these processes stand for a downward price movement there are several main differences between them. Correction is a controlled process in a sector with a specific time window. On the other hand, a crash is an abrupt downward movement. The length of such events is undefined, because it will end only when the activity within the market will be recovered.
Necessary business preparations
The most important thing that business should do is to reevaluate the investments and assess the portfolio several times. It will help to gain more confidence and to adjust themselves for a future correction.

Moreover, people can prepare the business with additional cost-cutting measures. Later on, it will help to contain enough funds to execute the most efficient trades during this process.
Duration of the common Market Correction
Commonly, the duration can be from several weeks up to multiple months. It is based on the necessary intensity of the process.
Strategies to execute at the time of Market Correction
Based on the given knowledge, investors should choose several strategies: long-term and diversification, because of the given circumstances. The cost is lower which gives multiple opportunities to save the initial capital and secure a larger profit.
Top news


Comments
Subscribe
Login
0 Comments
Oldest