
Momentum trading strategy is a very useful asset. There are many markets to use it on. Let’s check all the necessary information to master this strategy before applying it.
- Momentum trading: The definition
- Intraday type
- With stock trading
- Reasons and the way it works
- Rules
- Signals within it
- Relative strength indicator (RSI)
- Moving averages (simple(SMA) & exponential(EMA))
- Average directional index (ADI)
- Moving average convergence divergence (MACD)
- The momentum indicator
- Concept
- Learning the momentum strategy
- Ways to apply it
- Instance
- Its strengths and weaknesses
- FAQ
- Helping indicators
- Possible ways to automate
- Momentum trading & trend following
Momentum trading: The definition
Momentum trading based on the valuation changing speed of a certain asset. People quickly react to the changes and make short-term buys and sells. The market should include high liquidity and this makes short trades possible enough to be profitable.
Intraday type
This type of trading depends on a time window. Despite the fact that some people use this method in long-term deals, momentum strategy is best for short-term trades. One of the most common ways to trade is based on a 24-hour timeframe. Intraday trading is fast and precise.
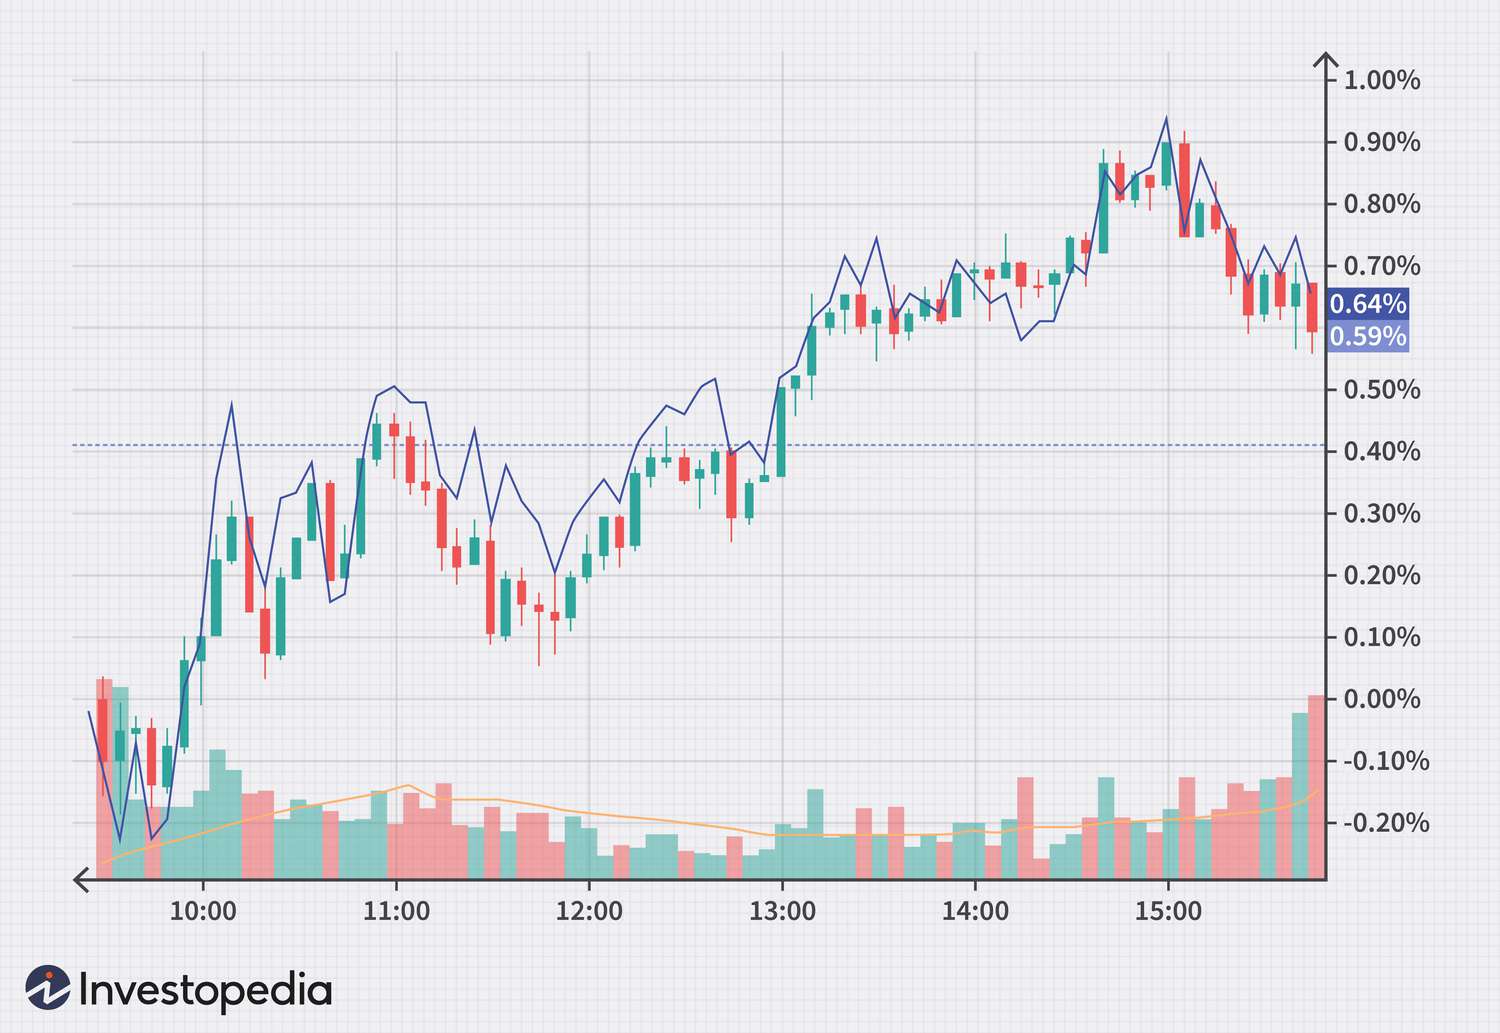
Market players buy and sell with an incredible speed. They search for the volatile assets which change its valuation with a high speed. A standard choice of an asset includes changes for at least $5.
With stock trading
Up to this point, we acknowledged that this type of trading is most efficient with the high liquidity. Share market is that kind of platform. Asset’s valuation changes continuously and it creates a big enough breathing room for the momentum traders. Based on company analysis, market players can make potential moves in this field of trading.
Moreover, this market gives you a tool to follow for the data of an asset. It is an exchange-traded fund. People can observe the assets with a high volatility and speed by using this instrument. This method will be followed by multiple assets in the game. Keep that in mind and be prepared for several deals with different shares within one timeframe.
Reasons and the way it works
Main reason for using this strategy is to play on constant asset’s changes. Traders exit and enter the market very fast to gain a profit from such stock. They find a share which cost is rising and buy it. After it gives any signs of decrease people sell it immediately. And then to another share. All-In-All, traders close one deal and go to the next volatile share.
Rules
When you apply this strategy in the market field, trading must be considered. You should think about all specific factors: other traders, all of the changes and some quite not obvious situations which later on will decrease your potential profit.

There are certain requirements for the right usage of this strategy. Let’s review the sequence:
- Find the volatile asset.
- Discover all potential outcomes before entering and exiting.
- Don’t be afraid to open a deal early.
- Hold the stock for the right amount of time. Be patient and smart.
- Choose a safe timing to close the deal.
Signals within it
There are several compatible indicators which can provide you the necessary information about the asset. Let’s dive deep into it.
Relative strength indicator (RSI)
RSI shows the overall changes in the stock’s valuation speed. It follows the asset throughout a timeframe and gives you information about potential changes in the future. RSI reviews a model of the stock’s overbought and oversold conditions, based on its own scale: 0 to 100. 30 & 70 are the basic borders for the oversold and overbought respectively.
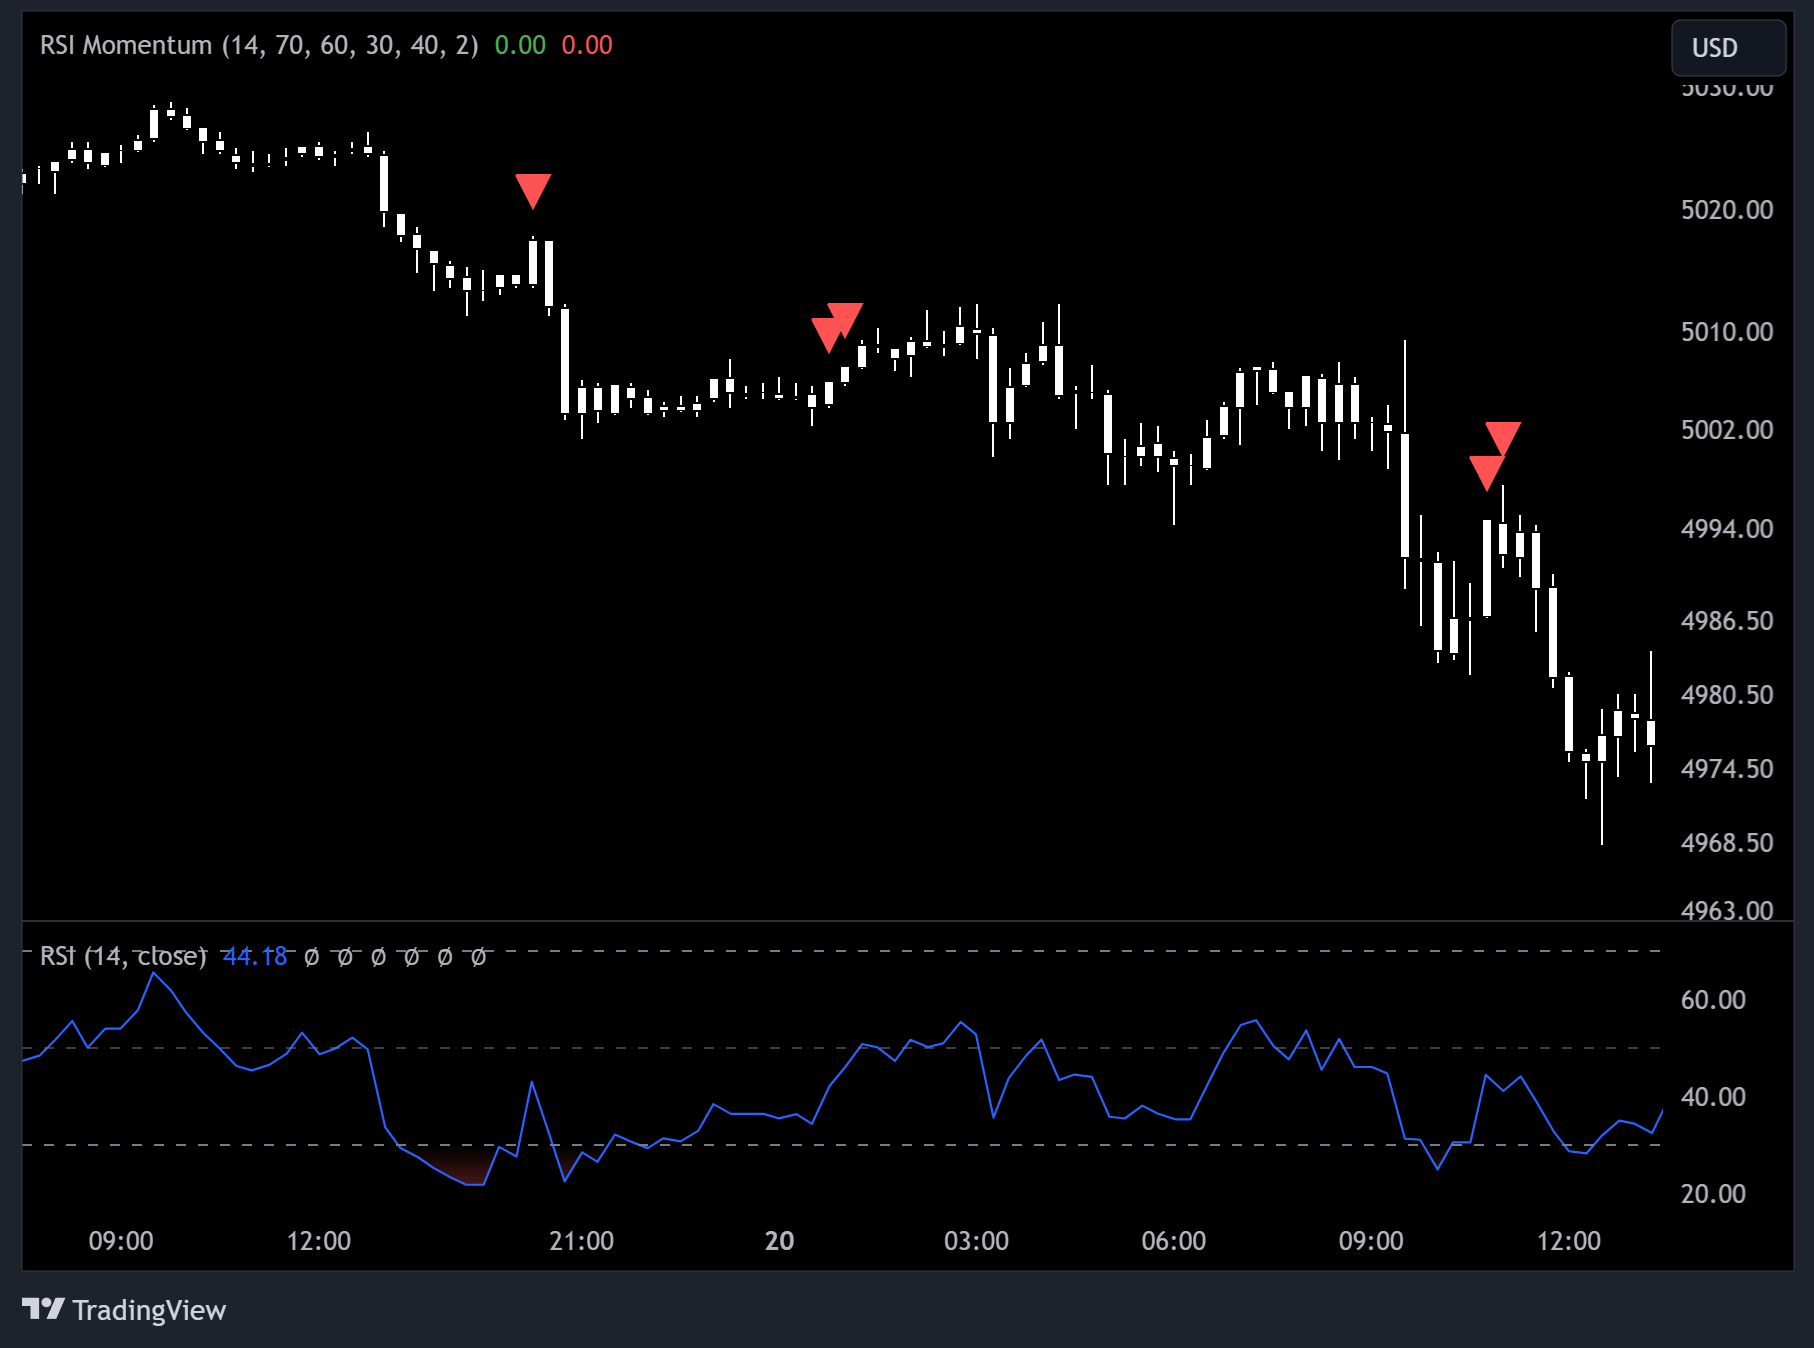
Depending on this indicator, you can discover potential reversals which are the result of the divergence or valuation swings. For instance, when prices reach new highs, the RSI shows a lower high than the previous one. That’s the start of a bearish divergence. It means that the asset will be affected by the newborn downtrend. Here is an open window for a momentum trader to enter and exit right before a huge change in valuation.
Moving averages (simple(SMA) & exponential(EMA))
The SMA is quite useful among all trading markets. The principle of following the valuation changes to discover the current trend is beneficial for all types of trading: longs and shorts. This indicator demonstrates the average cost of an asset through the observable timeframe.
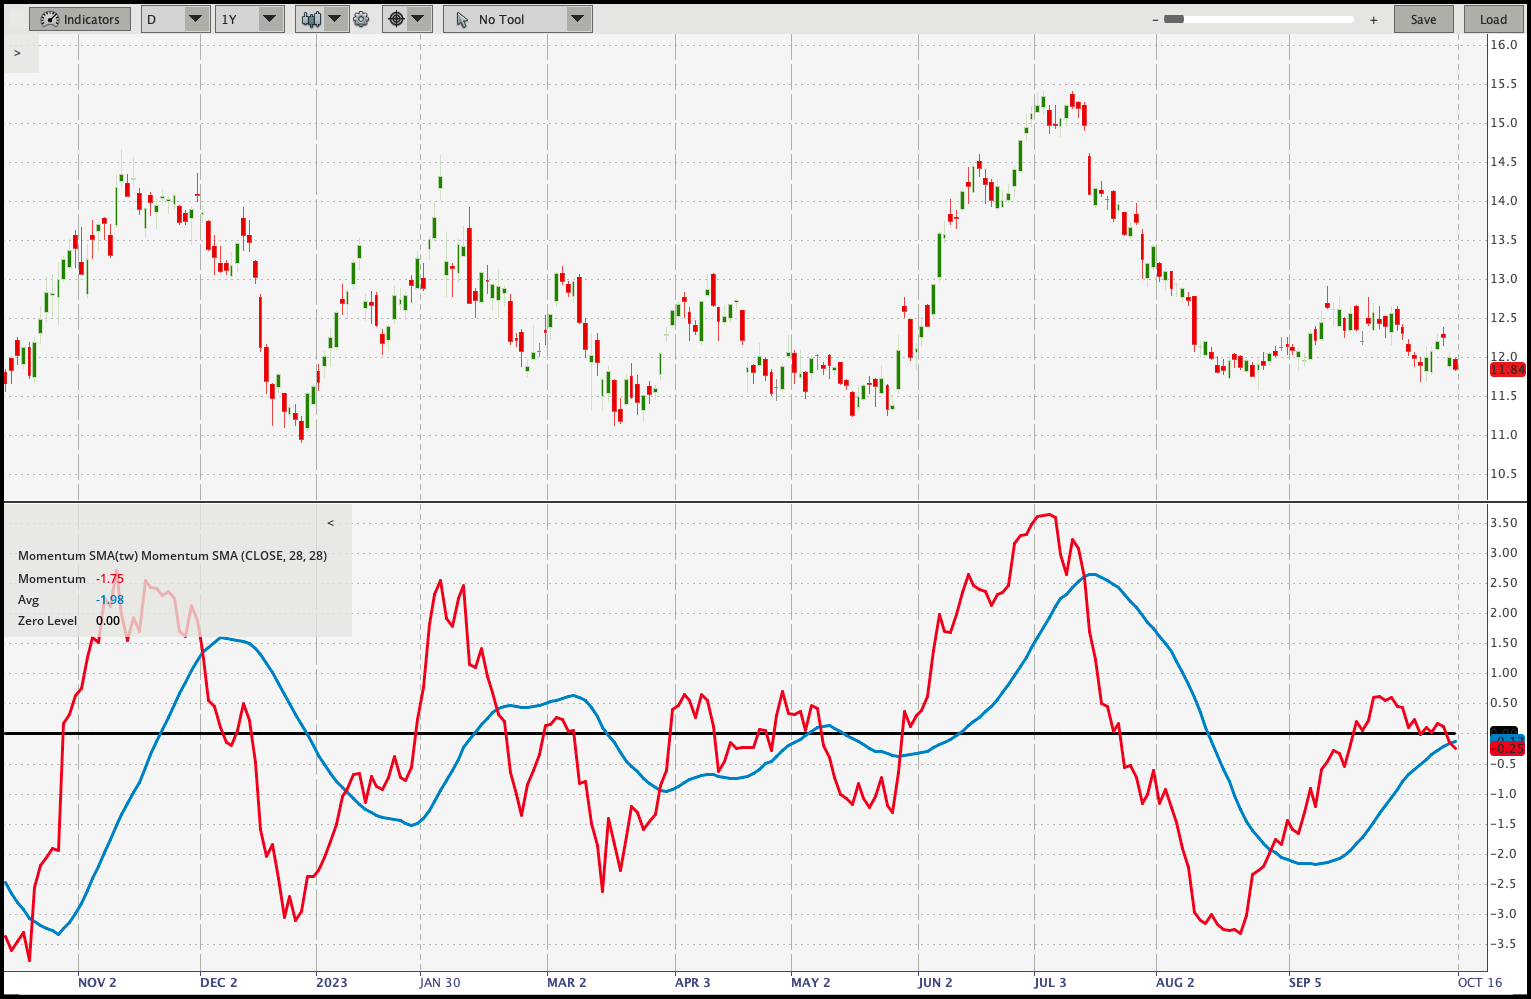
In addition, moving averages weren’t designed specifically for a momentum strategy. Although it is still an effective way to discover potential deal’s opening and closing timings. Also it is compatible with the other trading signals.
Average directional index (ADI)
This tool’s usage is about calculating trend’s speed changes: increasing or decreasing. To get the ADX you need to look at the moving average of valuation changes through a timeframe.
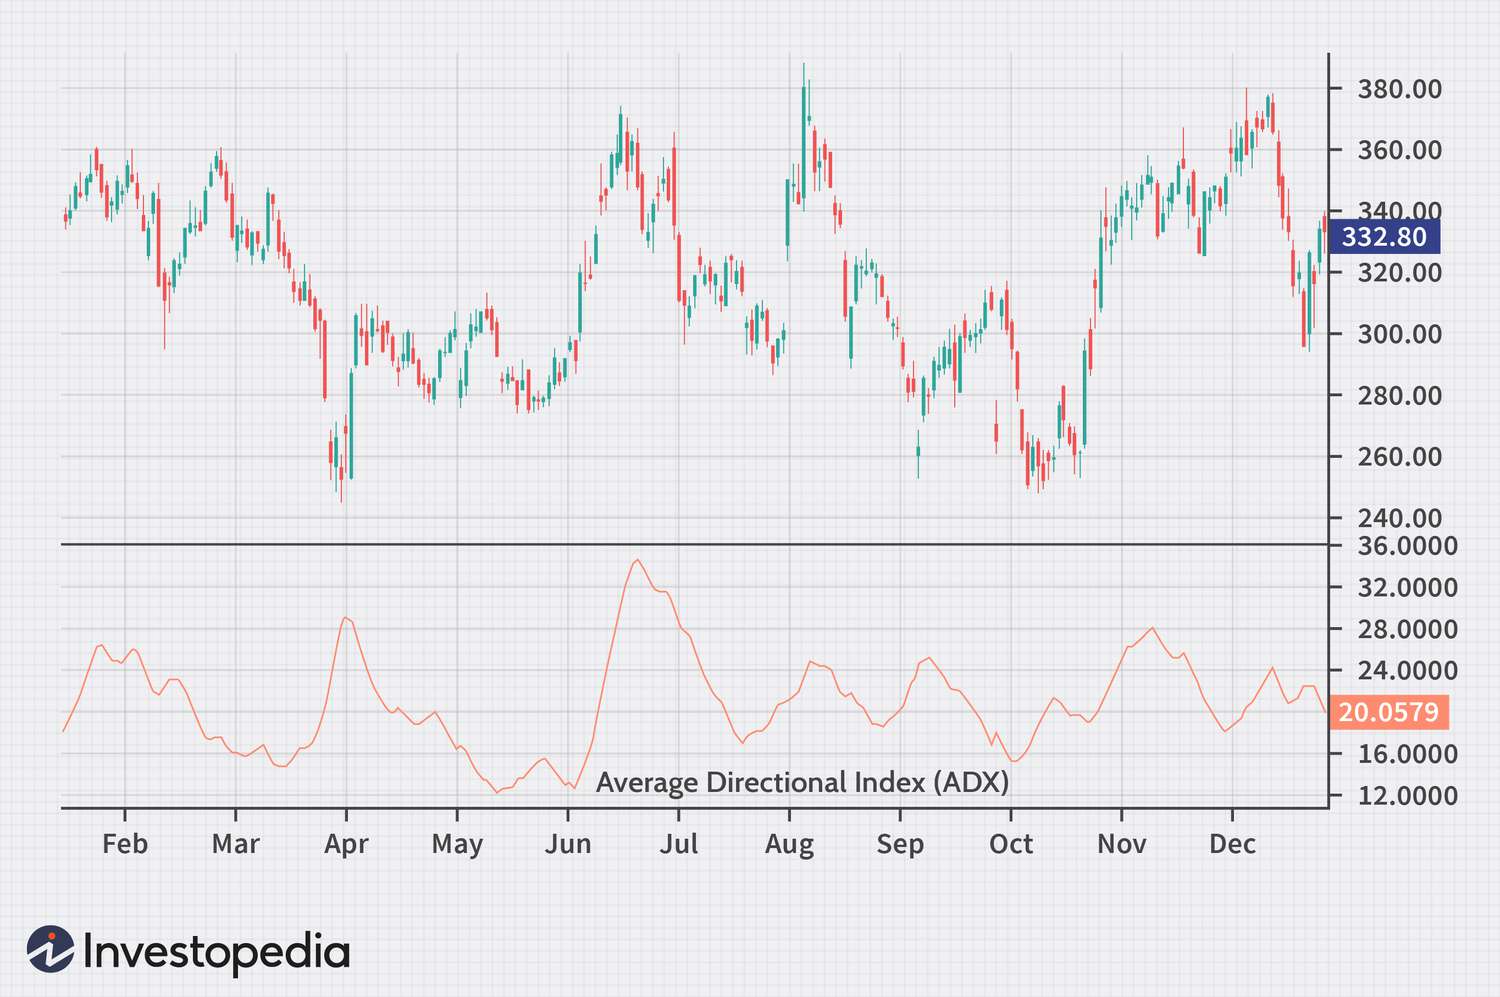
It is viewed by a single line on the chart. There are two types of the observable trends:
- If the indicator’s value is over 25: it is a strong tendency which means an increased rising in uptrend.
- If the indicator’s value is below 25: it is a weak tendency which gives you a sign to step back from a certain asset and close the deal in the near future. There is a possible reversal of the tendency in this scenario.
Moving average convergence divergence (MACD)
This tool gives you the necessary information about new tendencies. The MACD discovers the direction of the valuation’s change: bullish or bearish. It is based on moving averages. The most popular opinion about this indicator have two main points:
- Short-term moving average shows the current valuation’s change.
- Long-term moving average shows not only current, but past valuation’s changes too.
New tendency is defined when the degree of separation is good enough between short-term and long-term moving averages lines.
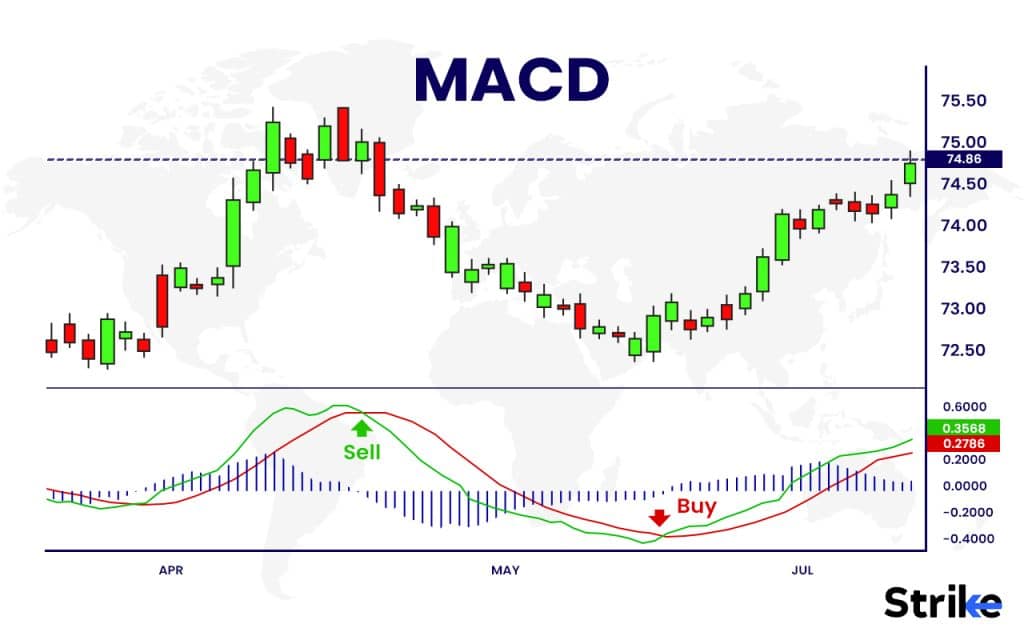
There are two types of confirmations with MACD:
- Convergence, which indicates the increasing power of the rising tendency.
- Divergence, which indicates the decrease in the current rising trend’s power and potential reversal to the opposite side of the movement.
The MACD is specifically used by market players to have a look at the future asset’s moving direction in the momentum strategy.
The momentum indicator
This tool works within a centreline’s values. That’s why it is an oscillator. It follows the different closing cost in a specific observable time window. This tool discovers the overbought and oversold of the asset. It uses the result of the rising or decreasing tendencies calculation which is based on valuation movements.
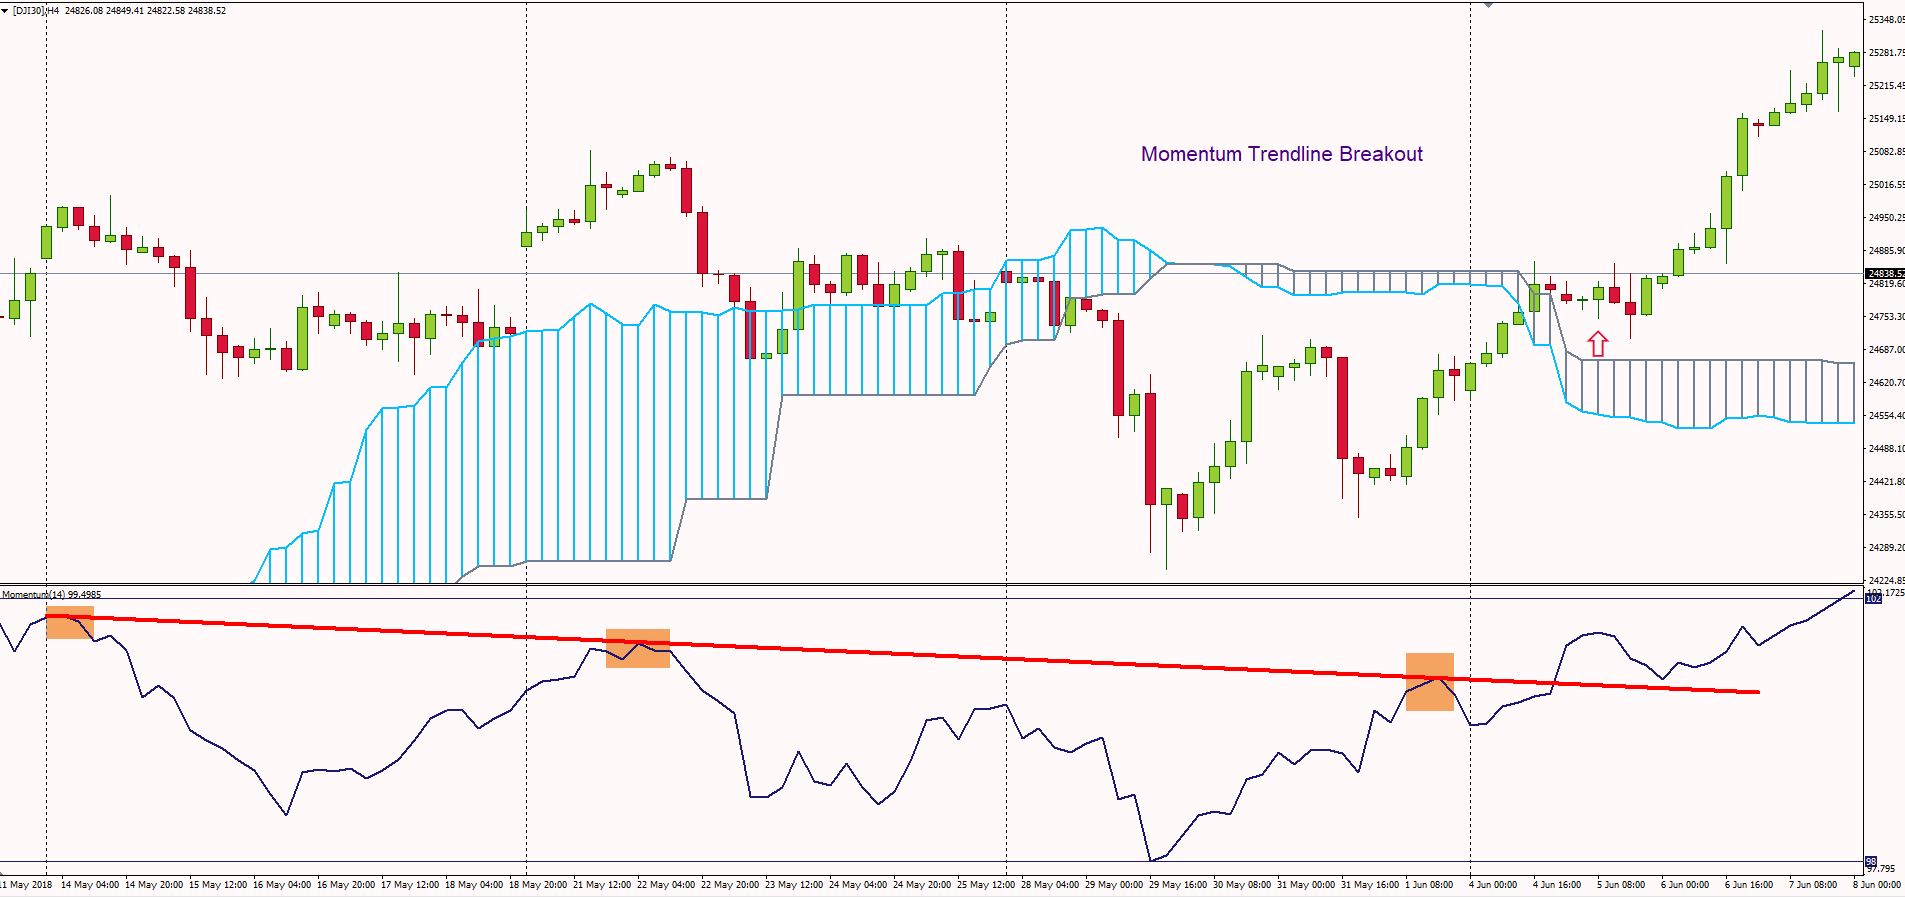
The momentum indicator shows specific signs to the market player whether it’s a buying or selling timing.
Concept
This strategy depends on short-term deals which are based on a current trend’s power. If the market is volatile enough for momentum traders, they learn about desirable asset’s changes and make a short, fast move to have an instant profit. If the asset’s movement is quite volatile, it makes the security more attractive to possible short-term deals.
When the time comes and the current tendency is slowing down – it is a signal for a momentum trader to exit current trade to gather the possible profit from the deal.
Learning the momentum strategy
Let’s review all the steps you need to follow for the momentum trading:
- Choose the security you want to trade.
- Decide the way you want to trade: long-term or short-term. Learn the strategy for the chosen way of trading. For instance: position trading for long-term deals and day trading for short-term deals.
- Develop your opening and closing strategy.
- Use a demo account to train your approach with virtual $20000.
- Work and practice with the technical tools to get the necessary information.
- Discover the liquid periods of an asset. Don’t be afraid to use risk management tools which can prevent future money loss.
- If you feel that you practiced enough to have a real trade – enter a real trading market and we wish you the best luck.
Ways to apply it
This way of trading has several strategies to work with. Let’s check them:

- Breakout strategy. Momentum traders search the security which passes the borders of support and resistance. This could mean the potential reversal in the asset’s movement direction. Market players see the opportunity to gain a profit from a right entry and exit timing.
- Trend-following strategy. People find the stock with a constant and powerful valuation movement tendency. Market players depend on it and open a deal until the tendency’s weakening.
- Moving average crossovers. This strategy is based on moving averages from different timeframes. Market players search for a point where a short-term moving average crosses a long-term one. It can give a signal of potential speed’s changing.
- Relative strength strategy. In this way of momentum trading, people compare security’s behavior to its analogs or a market index. If the stock shows higher relative strength – it can be chosen for future market moves.
Instance
For a better understanding of momentum trading we can review a presumptive example. We will be following for two assets: asset №1 and asset №2.

The observable period of action will be a six-month period. You have $50,000 to spend on each asset. Let’s review both of them:
- Asset №1 movement is incredibly strong. The upward tendency is powerful throughout the whole time frame. This asset’s cost rises with a high speed. It increases to $100 from $90 in the first month. This tendency is strong enough to boost the asset’s price right up to $180 at the end of the sixth month. This example shows the overwhelmingly strong tendency with no downfalls. In this case, you will double the initial $50,000 up to $100,000.
- On the other hand, we have asset №2. Its valuation is also $90 at the start. But the tendency’s opposite direction is quite obvious. The valuation drops every month. It drops to $45 at the end of the six-month period. It’s a huge loss to the trader. $50,000 turns to $25,000.
As you can understand from these examples, asset №1 is more attractive to be traded with. It has a powerful rising tendency and leads to a significant profit. Traders investment is based on the potential outcomes. In this case, it is profitable enough.
Asset №2 is under influence of the downward tendency. If momentum traders get the trend fast enough, they quickly react and make a short-term deal to reduce the potential loss.
All-in-all, you can adapt this strategy for multiple assets. It applies with a strong asset and a risky one.
Its strengths and weaknesses
Momentum trading strategy is quite useful, but risky enough. Let’s review it from both sides. First of all, we look through its benefits:
- This strategy can bring a very big income to your account, if you are qualified enough to detect market’s movements and tendencies.
- Momentum strategy is very useful for a short-term deal which can be very profitable.
- Its usage spreads wide through the different markets. This advantage gives a choice flexibility.

Do not forget that it has several disadvantages:
- The unexpected changes of the momentum which leads to several losses because of the price’s movement reversal.
- If a stock’s valuation is in a very strong tendency, the market can correct the cost in future. It prevents the stock from becoming overvalued.
- Human factor. You need to precisely choose timings of opening and closing deals. Nobody is safe from several mistakes.
- Trading within an unstable or a range-bound market can lead to several losses. These situations generate false indications. It may lead the trader to be confused and make several mistakes.
FAQ
Helping indicators
All tools help market players to discover the information about the current trend’s power and the possible reversals.
Possible ways to automate
You can automate the process by using specific algorithms within the trading system. People create a pattern of observation which depends on the chosen momentum indicators. It also includes a written parameter. This system will erase the human factor from the equation. Despite that fact, market players observe for their algorithms to add several changes which are based on the market’s volatility. It helps to gain maximum productivity.
Momentum trading & trend following
Momentum trading and trend following are both based on market trends. But, momentum strategy is used to trade a security with a powerful tendency in the recent time. It is mostly designed to operate with short-term deals in a small time window.

On the opposite side of the story, we have the trend following which is more effective in long-term deals. This is a way to trade for people who prefer to wait and play the long game, because they avoid short-term trades.


