


The “overbought” term refers to a share trading at a price exceeding its intrinsic or fair value. This condition typically reflects recent or short-term cost appreciation and anticipates a forthcoming market correction. Such assessments frequently derive from technical analysis of the security’s price history; however, fundamental analysis may also inform this determination.
So, an overbought stock may represent a suitable candidate for liquidation.
What exactly is overbought
When the price of something goes up too fast, it’s called overbought.
This happens when the price is “that” high “that” not “that” many people want to buy it, and investors who already own it want time to sell it at a higher price. So, there are fewer purchases and more sales, which makes the cost more likely to fall.
How to determine if a stock is overbought by using RSI
RSI is a way of working out when the price of something has gone up or down too much as well (but we’ll chat about that another time, as it’s a whole other topic). It’s a great indicator for knowing when it’s a good time to buy or sell.
And it can also warn you about impending price movements. Moreover, it can also help you spot assets that have been overbought.
How?
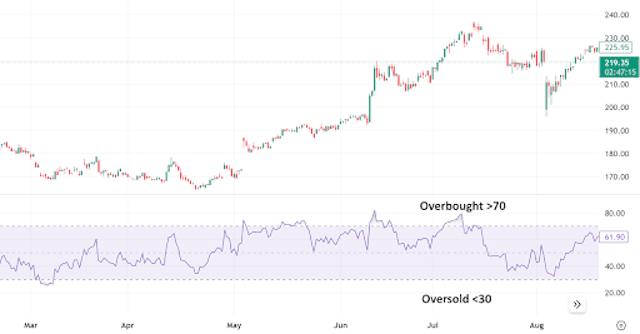
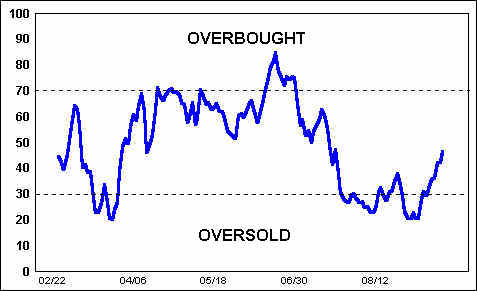
Pretty straightforward. Like, if the indicator chart falls below 30%, the asset is oversold. And if it rises above 70%, it’s overbought. The sweet spot – or gold zone – is between 30% and 70%.
Why you (probably) should care about oversold and overbought things at all
Sharp traders capitalize on market inefficiencies, thus recognizing both oversold and overbought conditions presents a significant edge. While an asset deemed oversold often suggests a buying opportunity, and an overbought is a potential sell signal.
But note that some traditional oscillators, designed to flag these extremes, frequently suffer from inaccuracies and lag, potentially leading to missed entries or exits. However, such is not really the case with RSI. Yet the stochastic oscillator may have some problems with accuracy, so consider carefulness when using it.
How to trade when the market is overbought
Trading in overbought conditions can be challenging, especially in a volatile market. However, with the right strategies and risk management techniques, one can take advantage of these situations.
And there is a lot of advice to be given here, but traditionally, stop-loss orders have always been more or less helpful against risk, so never give up on using them.
Overbought versus oversold
These two actually describe themselves pretty well. Overbought describes a period of time where there has been a significant and consistent upward move in price over a period of time without much pullback. This is clearly defined by a chart showing price movement below:
Top news


Comments
Subscribe
Login
0 Comments
Oldest