
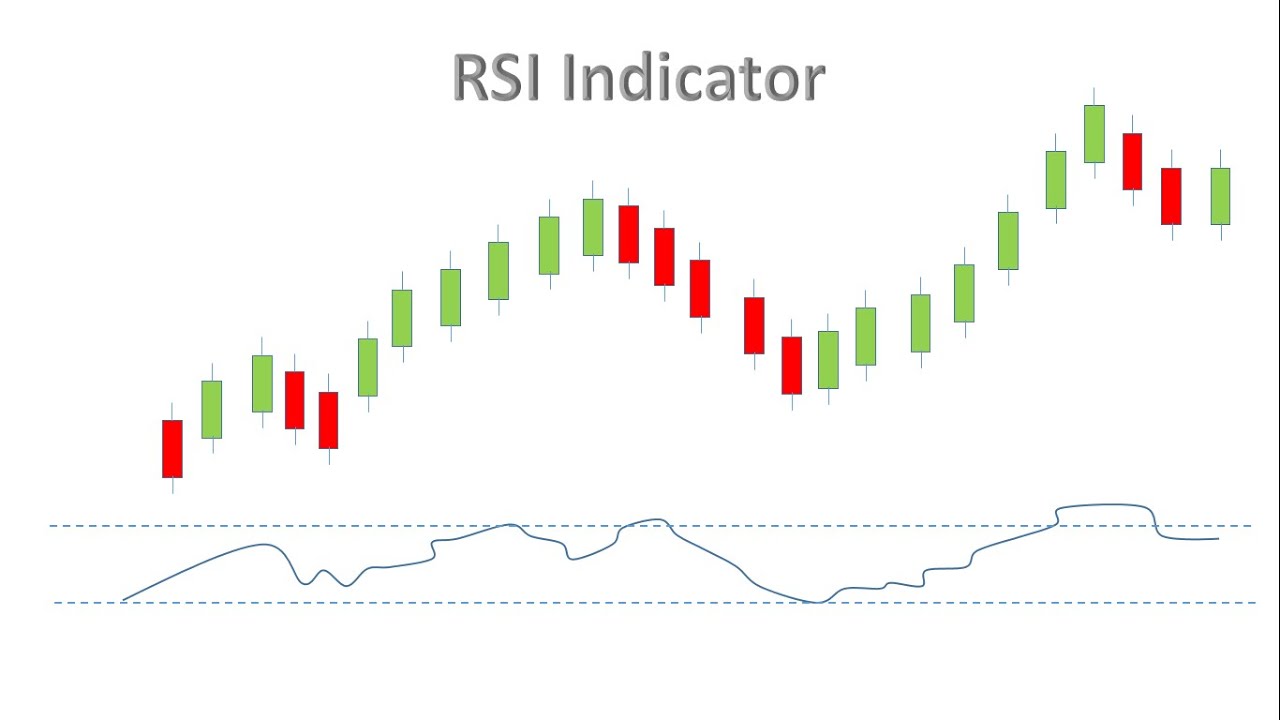
RSI is a valuation movement indicator. It calculates the way an asset behaves itself at the time. This index is visualized as a line graph on a 0 to 100 scale. The relative strength index helps to find the numbers above and below the cost border of that specific asset. It also shows assets which can be held for a trend reversal or a corrective valuation pullback.
- The calculation of the index
- How does the index process?
- The definition of index readings
- How to connect dots between asset’s price and index
- Things you should pay attention about
- Overbought & oversold
- Divergence
- Failure swings
- Trend confirmations
- Index with trends
- Index & moving average convergence divergence
- Index importance
- Index borders
- Index usage in real-time
- FAQ
- The definition of RSI
- Index calculation
- Index rate over 70
- The best index trading setup
- Index rate below 30

The index points out at the moment you should buy or sell. To be more specific: if the index shows rising over 70 or falling down below 30, it will be an overbought and an oversold condition respectively.
The calculation of the index
You need to follow two steps to count the index. First part of the calculation:
Gain and loss in this formula are the average percentages for a look-back period. There is a positive value for the average loss. Both periods with cost losses fallings and risings are counted as zero in the counting of average gain and loss respectively.
We use the usual number of periods to count the original index value, which is 14. For instance, the market closed higher seven out of the past two weeks with the primary average gain of 1 percent. The rest of the two-week period closed lower with a primary average loss of -0,8.
In this case, we have this equation:
After we have all information about the whole period, we can use the second step of the index formula:
How does the index process?
RSI shows the difference between the valuation rising and decreasing days. Depending on that, people can try to predict the asset’s cost in the future. If you connect the index with other market signs, it will guide you to have a good trading solution for the specific asset.
The definition of index readings
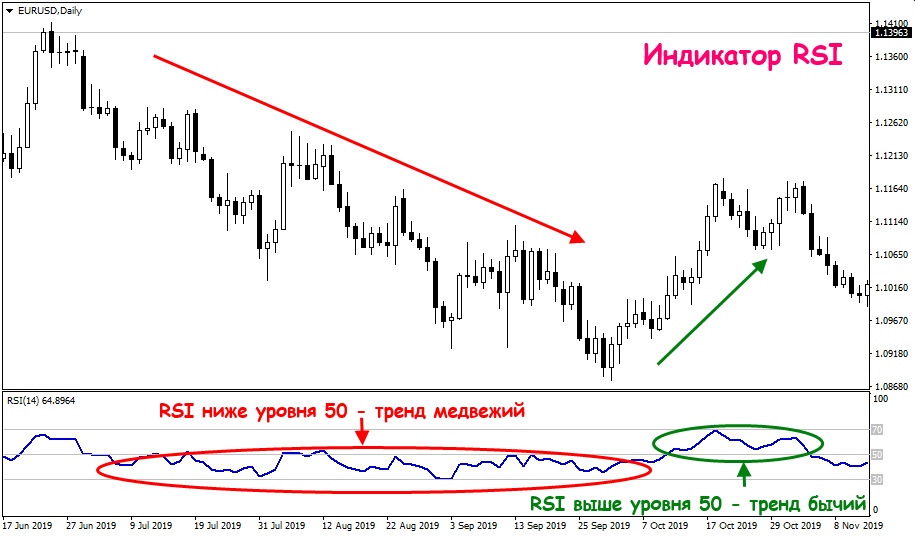
The index rate usually holds in the area between 30 and 70. It’s above 30 and below or equal to 70 in a rising trend. And when the valuation keeps decreasing, the index falls down to 30 or below.
In a situation, when the index does not hit 70 within the uptrend, it will fall below 30, which leads to a further valuation decrease. And the opposite situation is when it breaks up 70 in a downtrend and goes further. It’s another case of reversing the trend. You can also use index with trendlines and moving averages to take a far cleaner look at the asset’s valuation changes.
How to connect dots between asset’s price and index
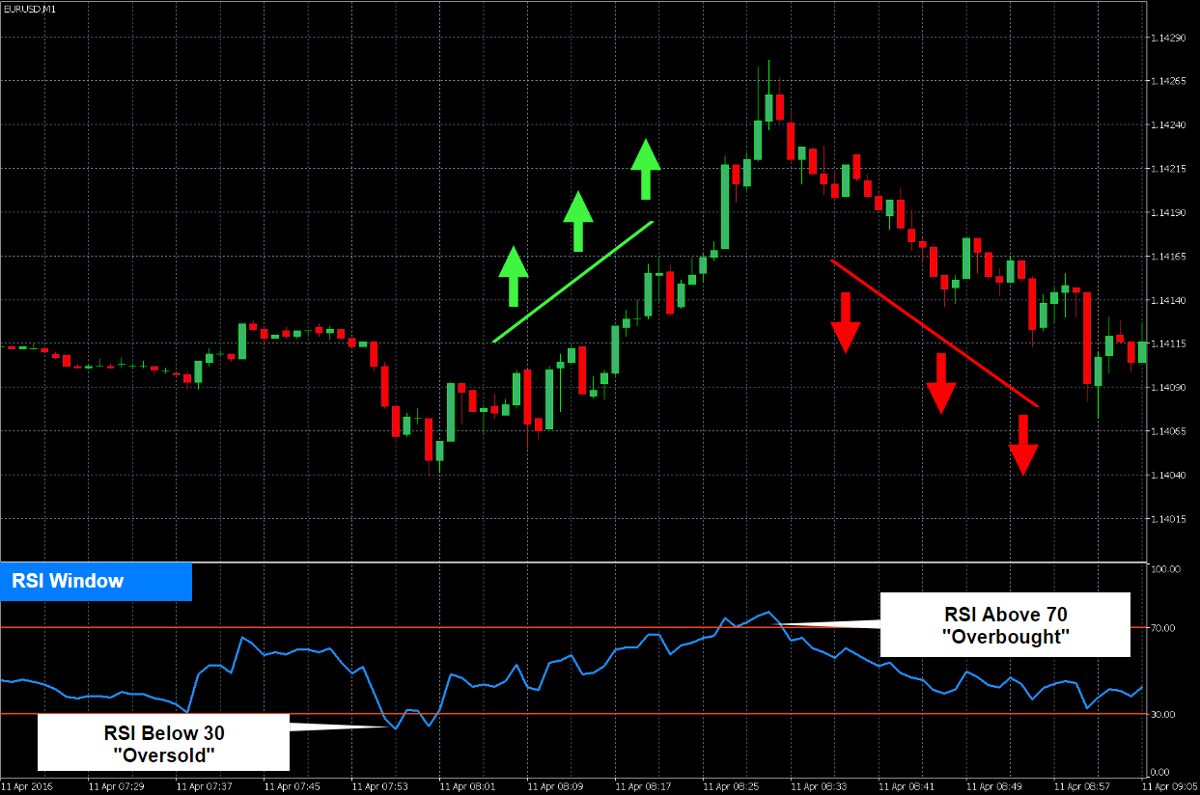
Index is connected to all recent valuation changes. It provides the necessary information about overbought and oversold stocks. So, how do you understand the index meaning? Let’s find it out. So, we know now, that primary borders are 70 and 30. When the rate is above 70 – it’s an overbought. And when the rate is below 30 – it’s an oversold.
With experience, you will gain confidence to pick the right time to buy or sell an asset with a right usage of RSI rate. One more type of interpretation of index is divergence. You can follow the differences between index and valuation, which helps to to detect the reverse movement of the asset’s cost.

This situation happens when RSI doesn’t fit with the current value trend direction. It leads us to discover a possibility of changes within a specific asset. When the RSI is rising less than the valuation, you should pay attention, because it can lead to potential downfall of the cost. In this situation, you should be prepared for selling. In the future, you will discover how to operate in different situations. Learning the patterns of RSI will give you a huge advantage.
Things you should pay attention about
Overbought & oversold
Overbought and oversold are specific conditions of an asset. Both of them are discovered while using the RSI reading method.
Basically, when the valuation flies out 70 and goes higher, it signals to the market player. It is a time of selling assets. Border is not strict, so you can choose the optimal time by yourself. It is called overbought.
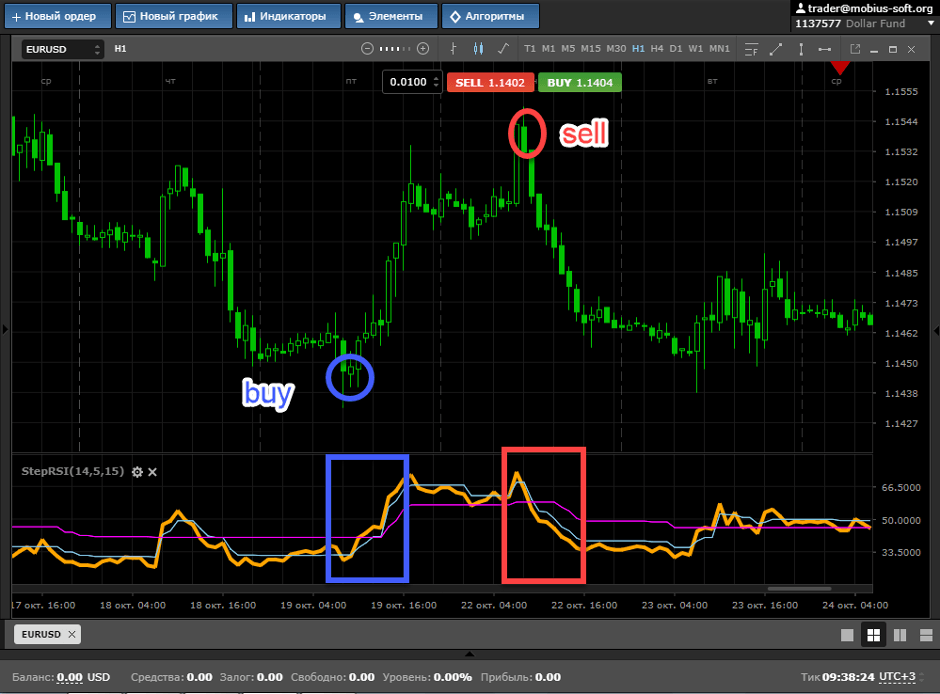
Same story with the decreasing. When the cost drops rapidly and goes below 30, it shows the buying timing. And as in the previous situation, you also can decide the best time to buy. It is called oversold.
Divergence
Index divergence is a situation when RSI Rate and valuation changes do not match up. It leads us to the conclusion: the process of cost changing will possibly reverse in the nearest future.
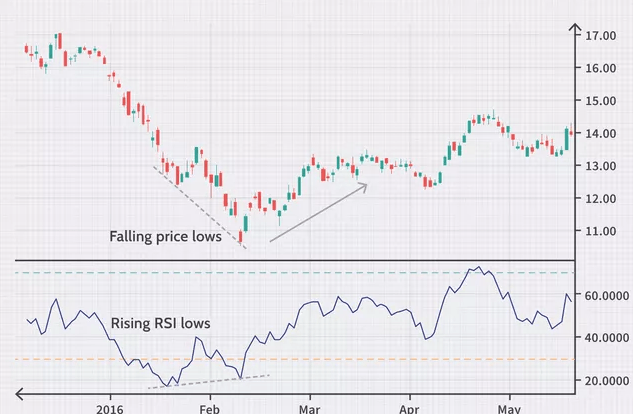
Divergence divides in two variations:
- Bullish ESI divergence. It’s the difference in downtrend between index and valuation: index makes higher low, than the actual cost. This type of divergence shows the buying timing.
- Bearish RSI divergence. It’s another difference, but in an uptrend. Index makes lower highs, than the valuation. This divergence shows a second timing: timing of selling.
Failure swings
It is one more way to discover the possible valuation reversal. Swings are fully connected with index, but not with the price. It is divided into 4 steps. We have got Bullish and Bearish swings.
Bullish failure swing consists on:
- Index dropping below 30 (oversold).
- Index going higher than 30.
- Index falling down to 30.
- Index rising higher than its previous high level.
Bearish failure swing consists on:
- Index increasing higher than 70(overbought).
- Index falls below 70.
- Index increases up to 70.
- Index decreases further than its previous low level.
Trend confirmations
There is no guarantee that certain indicators will lead you to a non–losing way of gaining money. Andrew Cardwell observed the market, learned the divergences and discovered certain connections between trends and divergences. Moreover, he described reversals. Here are the main points about uptrends & downtrends:
- Bullish divergence happens in a Bearish trend.
- Bearish divergence happens in a Bullish trend.
- Bullish & Bearish divergence often lead to a slight valuation change, but not the trend reversal.
In case of reversals, Cardwell divided reversals in positive and negative. Both of them are the divergence’s opposites.

Brief explanation:
- The valuation makes a higher low and index makes a lower low. It’s a positive reversal. This type of reversal happens only in Bullish trends.
- The valuation makes a lower high and index makes a higher high. It’s a negative reversal. And this type of reversal happens only in Bearish trends.
Reversals can be used in certain situations, when cost moves faster than index. Both reversals are good instruments for trend confirmations.
Index with trends
First of all, you need to connect the current main trend with the index in a right way to get a good understanding of the situation. At the beginning, you need to have a full knowledge of the leading trend. Many traders draw a straight horizontal line between 30 and 70. You need to perform it at the strong trend movement timing to get the clear view of the main trend and extremes.
But index is not as good in trending markets as in trading ranges.
To solve this problem, you need to understand how the trade signs should be used. The obvious answer is to follow bullish signs mainly at the time of cost being in a bullish trend. Same thing for bearish signs. You should operate with them mainly in bearish trends. This will help to react at the right timing and make a better decision in a certain situation.
Index & moving average convergence divergence
MACD is an indicator, which is based on trend movements. It shows the interaction between two moving averages of an asset’s valuation. MACD line = 12-period exponential moving average – 26-period exponential moving average.
Signal line is situated on the top of the line. It is a 9-day EMA. This line can be a catalyst to buy and sell signs. Market players can sell an asset at the MACD crossing down the signal line timing. And the opposite situation when it crosses up. Traders can buy the asset, depending on that sign.
The index is used to discover asset’s overbought or oversold in connection with latest valuation. It is counted with average cost gains and reductions over a certain period. The usual period is 14, with numbers included from 0 to 100.

Moving average convergence divergence calculates the interaction between two exponential moving averages. On the other side, index, which follows the speed of valuation changes in connection with latest costs. You can use both of them to have a better perspective on the asset’s market situation.
For instance, the index can indicate an overbought whilst the MACD shows the different picture, where the dynamic of the valuation rise is still positive. Same story for the opposite situation with oversold.
Index importance
Traders have a significant advantage, if they master the index usage. Here are few reasons why:
- Index helps to gain knowledge about possible asset’s cost in the nearest future.
- Index can assist people with checking trends and trend reversals.
- RSI may show you the overbought and oversold timings of a specific asset.
- RSI can guide you to short-term deals at better times.
- Index is compatible with other indicators, which gives a wide specter of the market picture.
Index borders
The index is mostly dependable on the long-term trends. You can have some problems with knowing which reversal signal is true or it’s a misunderstanding.

For instance, false signs can be when a decline in a stock happens at the time of bullish crossover. Or another example, but with bearish crossover, and here the stock will rise up. All-in-all, the index is most dependable in a trading range, because it will be between bullish and bearish movements.
Index usage in real-time
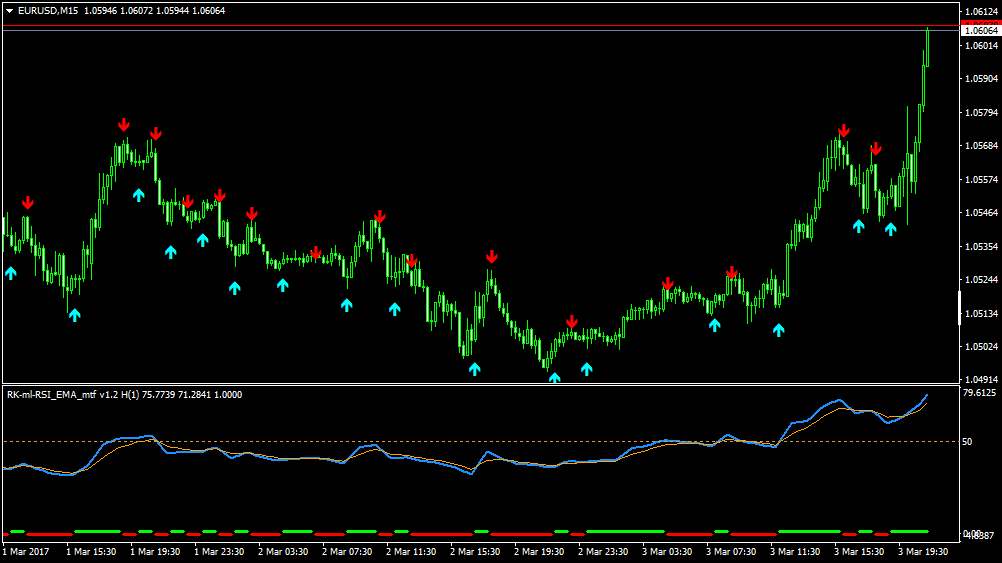
For instance, let’s look at the situation where the asset rises with huge speed. When the index reaches 70, people can start a reversal by selling off to have an income. And the opposite situation with the bottom borders happens. When the index falls below 30, market players can decide to buy, hoping that the valuation will reform and rise up. To sum up, people often use the index as a detection point of buy and sell.
FAQ
The definition of RSI
RSI is the technical tool of gaining knowledge about future asset’s valuation changes. It shows the points of overbought & oversold. Index helps trader to make a better decision in the future market situation.
Index calculation
Index is calculated with these equations:


Index rate over 70
Index shows the overbought of an asset and it’s a possible time to sell to gain profit, because in the nearest future valuation will usually decrease.
The best index trading setup
You should use an index in 14-period with borders around 30 and 70. But the conditions are flexible, you need to consider it, depending on the current asset’s trends.
Index rate below 30
Index shows the oversold of an asset and it’s possible time to buy. Afterwards, the price will rise up, and you can gain a solid profit, if you buy at the right time.


