
Stochastic oscillator is a very useful tool to detect specific trading situations. It has different methods of usage. Let’s discover this indicator.
- The definition
- When was it introduced to the market
- Operation principle
- How to calculate it
- Interpretation of its values
- The usage of this indicator
- Overbought & oversold
- Divergence with oscillator
- Crossing lines
- Bull & bear
- An instance of the oscillator
- RSI & stochastic indicator
- Indicator’s restraints
- Advantages & disadvantages
- FAQ
- How to look through the stochastic oscillator
- What is %K
- What is %D
The definition
Showing the differences and connections between the valuation of the asset at the end of a specific time frame and its cost throughout an observed time period is the definition of a stochastic oscillator. It is also bordered by 0 & 100 on a scale from each top and bottom sides.
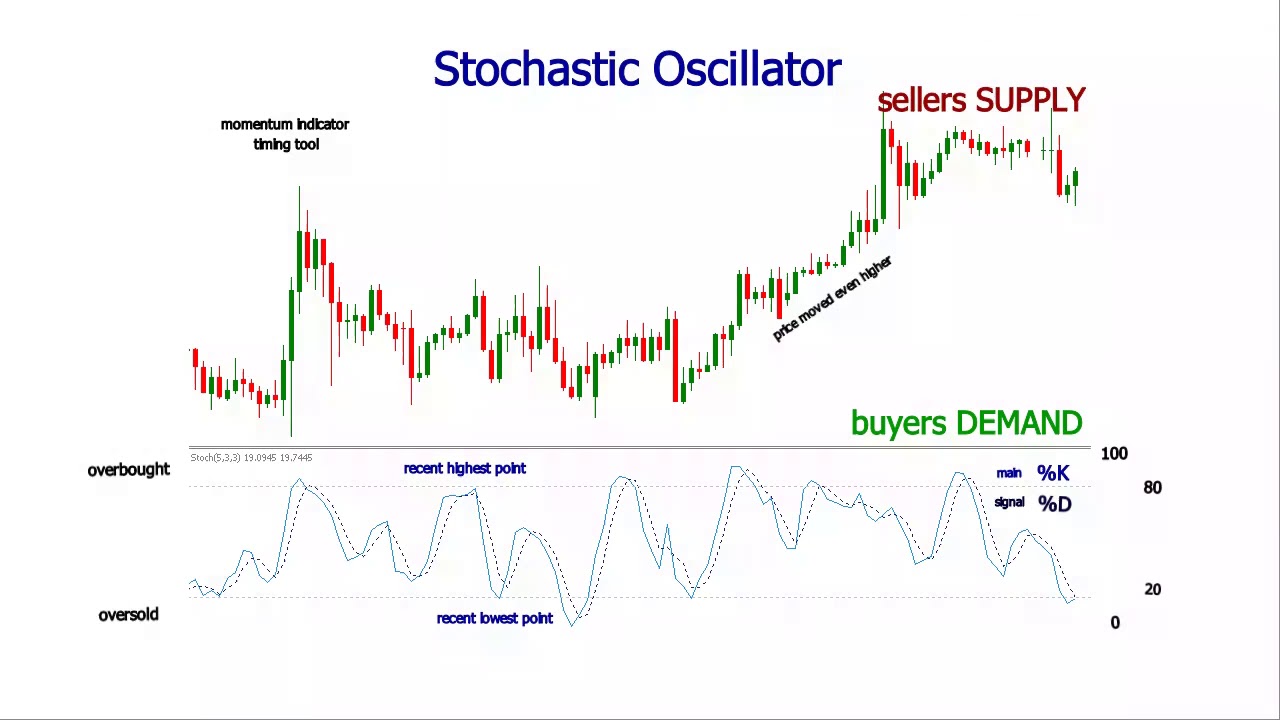
To make the observation cleaner you can set up the necessary time window or erase a moving average from the equation. Its practical usage is based on creating overbought or oversold signs.
When was it introduced to the market
George Lane created this method of identification at the end of 1950s. It covers the two-week period of time. People can get the knowledge of valuation’s movement speed throughout the chosen period of time in comparison to the cost at the end of the session.
Lane said that the oscillator uncovers one simple fact: asset valuation’s movement speed is different to the speed after the changing of direction.
It helps to get the current potential reversals in tendencies: bullish or bearish, which provides you a huge amount of important knowledge about the future cost changes.
Operation principle
As you get from the beginning, it has a specific range to work with: 0 to 100. Its main function is to get the right timings of asset’s oversold and overbought status.

As with support and resistance, there are two borders from each side:
- 20 – it is a sign of oversold status.
- 80 – it is a sign of overbought status.
Despite that, there are several conditions which influence the reversal of the asset’s movement. For example, a powerful tendency can move the market further than these numbers.
Its structure is quite simple at first look:
- One line shows the exact number for every session.
- Second line uncovers the 3-day moving average.
If both lines cross each other at the same point: that is a sign of a change in asset’s valuation movement speed. Moreover, if we discover the divergence between the oscillator and main valuation’s movement direction, we will get another meaningful sign of a potential reversal. It is often being used as a detection of time to buy or sell.
How to calculate it
However, there is a clarification. There are two types of stochastic oscillator:
- Fast stochastic sign: %K, current value of the indicator.
- Slow stochastic sign: %D, three-period moving average of a current value of the indicator.
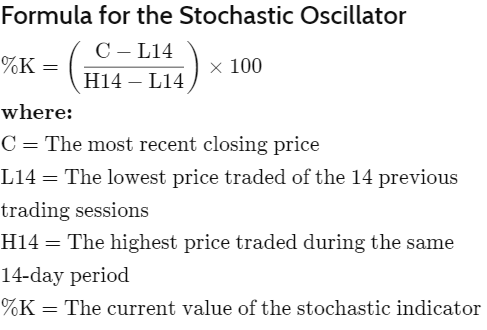
Basically, it shows that after a huge rising tendency the valuation will be around the high before the end of session. And the opposite: if there is a strong tendency of the valuation dropping, the cost will be near low at the end of the session. Once %K crosses %D, there is an indication of a potential direction change.
Interpretation of its values
This indicator shows the price on a chart in the 0 to 100 range. In that case, 0 means the minimal asset’s valuation of the observed time frame and 100 is viewed as the maximal. As you already know, there are two indication’s border values: 20 & 80. 20 means that the current cost of the asset is close to the lows and 80 means that it’s close to the peak.
The usage of this indicator
Overbought & oversold
Oscillator is often used as a marker for buying and selling timings. Here is why.
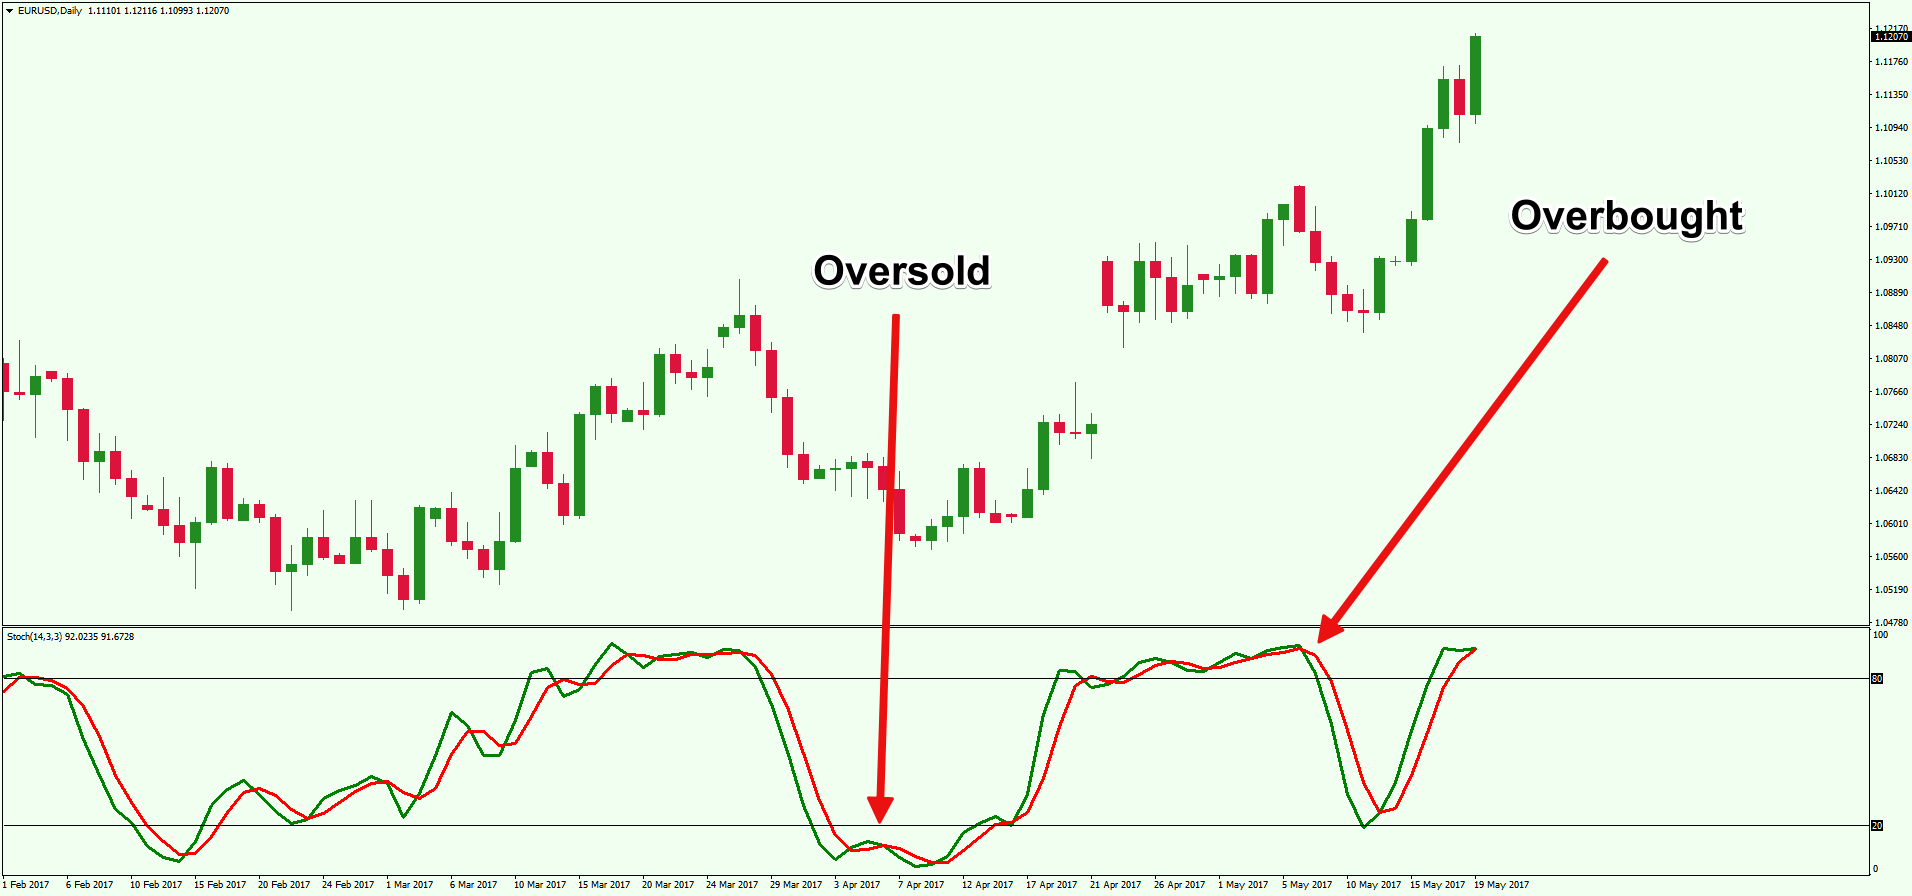
We have two cases:
- Indicator’s value drops below 20 and starts to move up: this is a sign of potential valuation rise. In this situation, it shows the necessity of buying the asset.
- Indicator’s value rises above 80 and starts to decrease: this is an indicator of a possible valuation big decrease. This specific situation is about timings to sell the asset and at that point – this a good enough moment.
Despite that, you need to be sure of the reversal. Both of these conditions can last longer than expected. Awareness of this fact will improve your identification of the specific moments to make a move on the trading field.
Divergence with oscillator
This type of usage is connected with the specific valuation changes. When the cost moves higher or lower than its initial borders and the oscillator does not include these changes, it indicates the potential reversal movement.
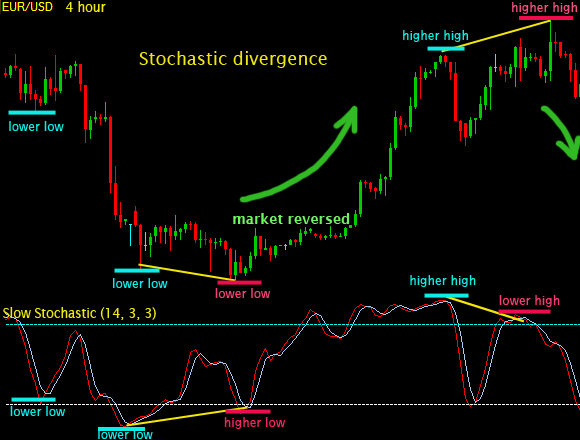
Let’s review both of divergences:
- Bullish divergence. In this case,it’s an obvious difference between the valuation change and the oscillator value: indicator shows a higher low than the asset’s actual cost. This often is followed by a reversal rising movement.
- Bearish divergence. On the other hand, a stochastic indicator shows a lower high than the asset’s valuation. That is a sign of a reversal. This time, the cost will be decreasing in the near future.
Don’t forget to overlook the market and verify the divergence. Rushing too early without awareness will be a huge mistake.
Crossing lines
As we discovered earlier, we can have a situation where both fast and slow oscillators cross each other. It helps to discover the overbought and oversold points of trades.
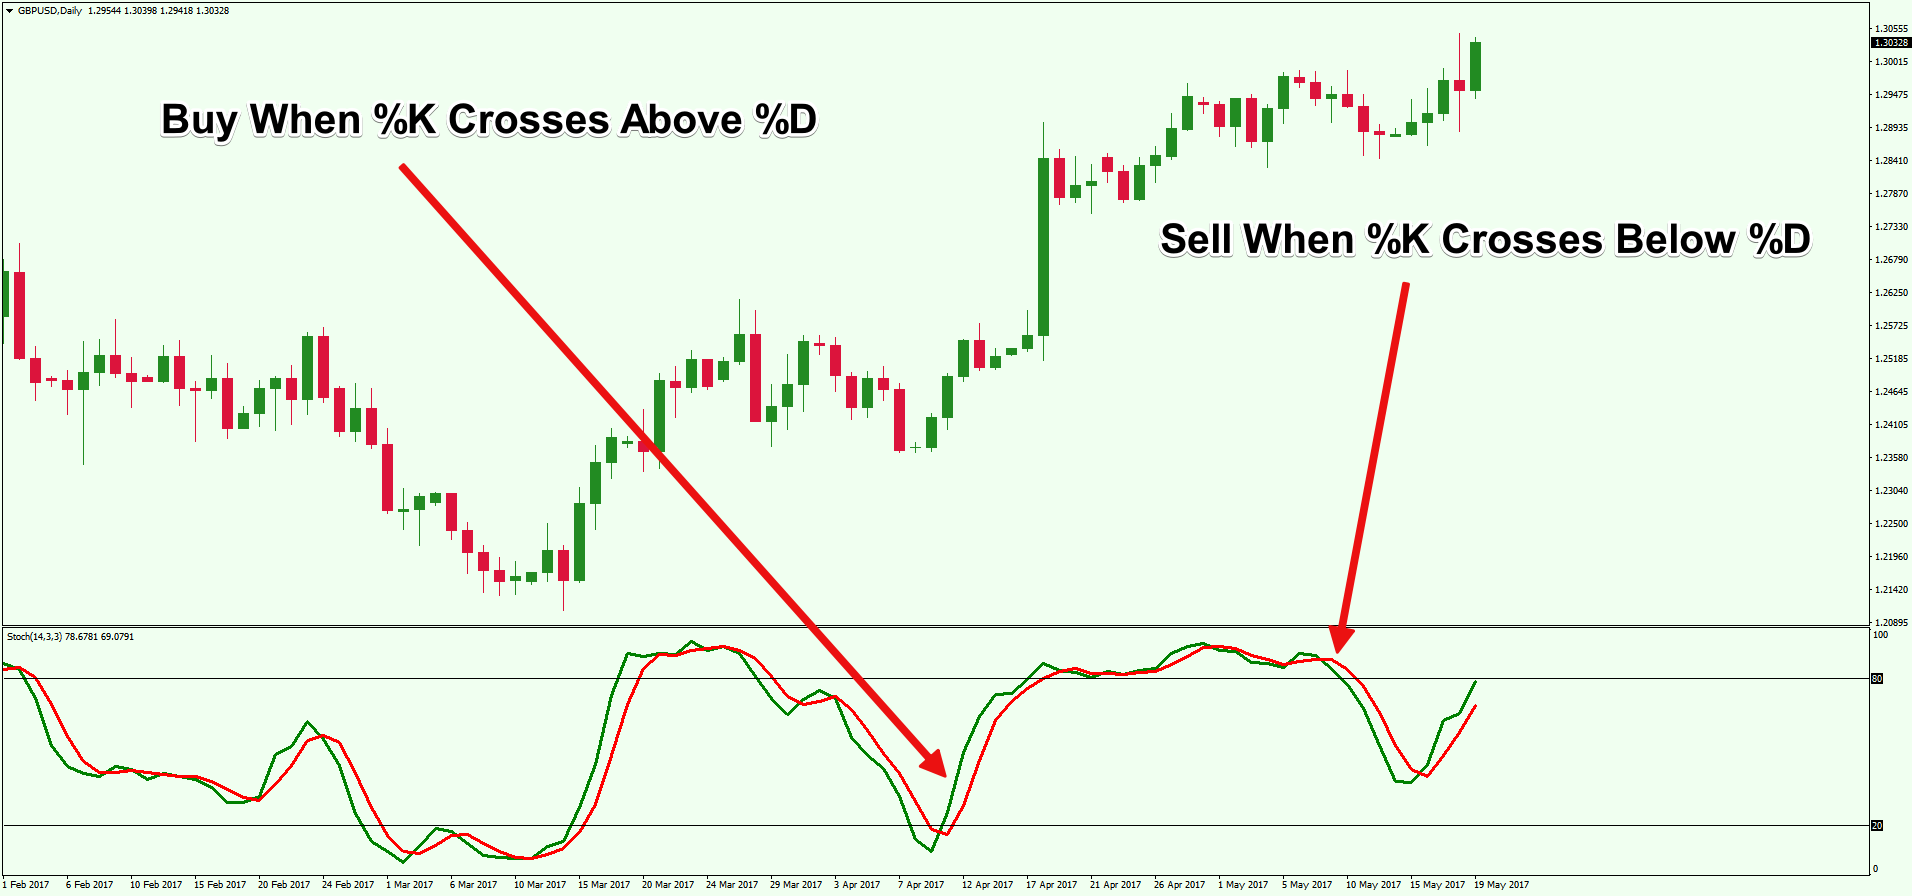
If the current oscillator value is rising and intersects the three-period moving average of itself – that is the sign to buy the asset, because of the current oversold region.
To clarify that the signal is right, market players check the oscillator’s valuations throughout the period to be sure that it’s the same crossing direction. This is a way of trading by following the tendencies.
Bull & bear
One more efficient way of oscillator’s usage is to discover bull and bear types of trading. Let’s look at each one:
- Bull type. If the oscillator shows a higher high than the actual valuation, it gives a sign that the speed of changes is becoming faster. It signals about a future valuation rise. In that case, people usually intend to buy an asset after a small cost pullback. That includes the oscillator dropping below 50 during the pullback and recovering its value afterwards with a potential rising.
- Bear type. That’s the opposite story. In this situation, the oscillator’s valuation decreases to a lower low than the actual asset’s cost. That’s the signal to sell the stock right after a short rebound.
Be aware that this indicator has its own specter of usage. All-in-all, nothing can work perfectly and the oscillator is not an exception. You need to have a full market picture to identify such points of trading.
An instance of the oscillator
As we get to the practical example of this indicator, let’s review the structure. The average and base time frame is a two-week period. Here is the formula for the necessary calculation:

To be more specific, let’s improvise some values. The whole time frame’s high will be $300, low will be $250 and the current close will be $290. Let’s solve the equation by the formula.
(290-250) / (300-250) * 100 = 80
So, what do we get from the result in this case: the oscillator shows us that the asset is very close to being in overbought status. We discovered that by viewing the closing valuation and its highs and lows. After this comparison we have the answer to our question.
RSI & stochastic indicator
Both indicators follow for the valuation’s changing speed. Their cooperative usage is not rare. Despite that, there are several fundamental differences in index and stochastic indicator.
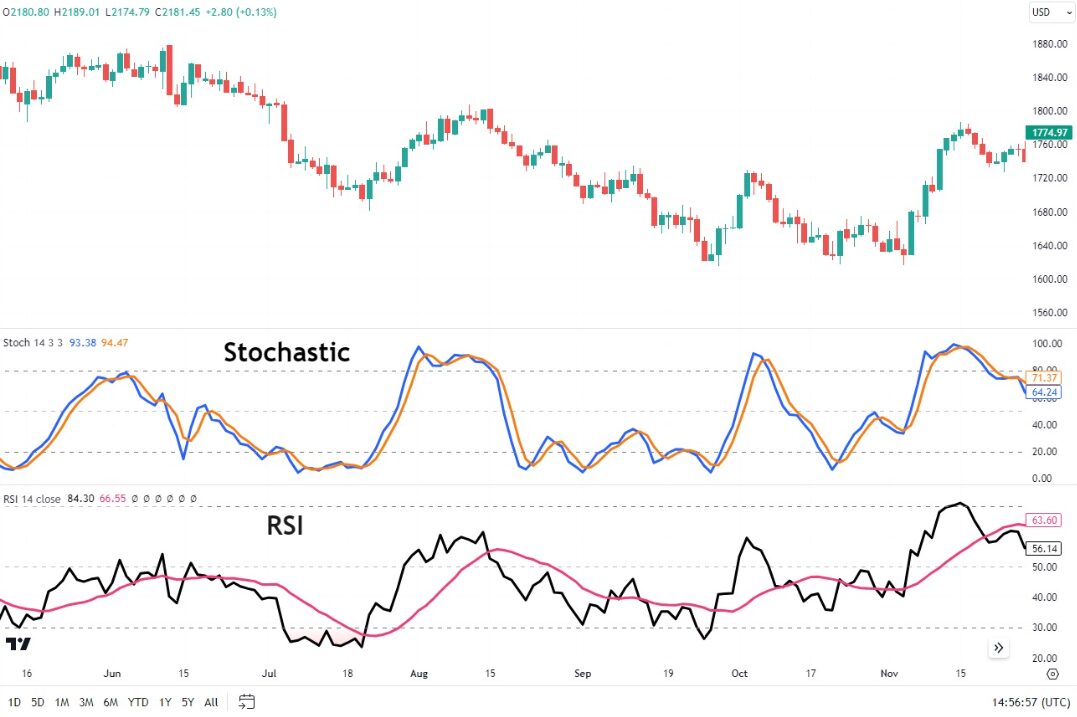
For instance, the stochastic indicator is based on the guess that the current tendency is supposed to move in the same direction as the closing valuation.
To sum up, stochastic indicator is about limited trading ranges and RSI is about trending markets.
Indicator’s restraints
The main problem with this indicator is about fake signs. It uncovers itself if the valuation’s changing is different compared to the oscillator’s value. You should be aware of that and review the current market tendencies to verify the potential signals as true ones. The direction of movement must be the same to have a confirmation.
Advantages & disadvantages
The main advantage of this indicator is the ability to detect particular market situations. It’s useful to get the entry and exit trading points. In fact, it is pretty compatible with other technical instruments. Although, it might be dangerous to use it impatiently because it can often give you the false indication which is not not matching up the whole market picture.

You already know that nothing can give you an ideal perspective on the potential market situation, but if you use the oscillator wisely enough – you can get a better result.
FAQ
How to look through the stochastic oscillator
This indicator has a 0 to 100 range. 0 – minimum valuation of an asset, 100 – maximum asset’s cost. There are two borders: 20 and 100. 20 stands for a low trading price and 80 stands for a high trending price.
What is %K
%K stands for the current asset’s price. It shows the relationship between the latest valuation range and the current stock’s cost. It is also known as a fast oscillator.
What is %D
%D is a three-period moving average of %K, also known as slow oscillator. It shows that tendency’s directions are the same in the observable time frame. Also, it provides you with the current valuation changes in a long-term period of time.


