
Bollinger bands are very useful and there are several trading strategies which depend on this indicator. Let’s review the list of functions of this tool and methods to apply these abilities to the trading action.
- What actually are Bollinger Bands
- What does this tool used for
- Measuring the volatility
- Determination of current trends
- Identifying reversals
- Determination of the overbought/oversold condition
- Technical tools which are in relation to Bollinger bands
- Bollinger bands with additional technical tools
- Bollinger bands in trading
- “Squeeze”
- Breakouts
- Walks
- Advices for reaching the best result
- Benefits & limitations
What actually are Bollinger Bands
It is a technical tool which is used for measuring market volatility and identifying possible points of entry and exit.

Its structure contains three lines (bands): upper, middle and lower. The middle band is a simple moving average (SMA). Commonly, it is a 20-period SMA. Each upper and lower band is a standard deviation from the middle line. Usual value for the standard deviation is 2.
This envelope is flexible and adapts to the changes of market volatility which can help to have a visualization of the valuation movements. Such changes are related to market volatility.
What does this tool used for
This is an efficient tool which is used for several objectives:
- To measure the volatility.
- To determine the current trend.
- To identify reversals.
- To determine the overbought/oversold condition.
Let’s review each function.
Measuring the volatility
The provided picture of the asset’s volatility is very efficient because it is viewed directly on the valuation chart. This indicator shows both states of the volatility: decreased and increased. During the increase the bands widen. Oppositely, at the time of decreasing they tighten.
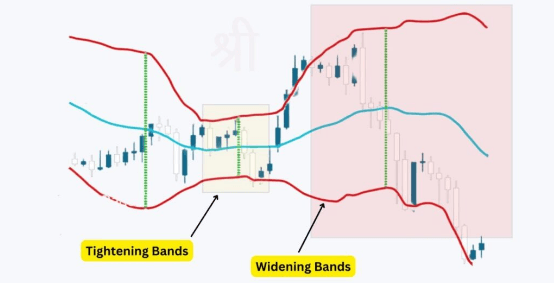
Such visualization can give the necessary intel for a market player to be ready for the future cost changes. Also, it helps to determine good enough entry and exit timings. Take a look at the example of widening and tightening bands.
Determination of current trends
Bollinger bands have more to offer: determination of current trends. For instance, the valuation is continuously higher than the middle line: it is an uptrend. Same story with a downtrend: the cost constantly staying lower than the middle SMA. Review the visual instance below:
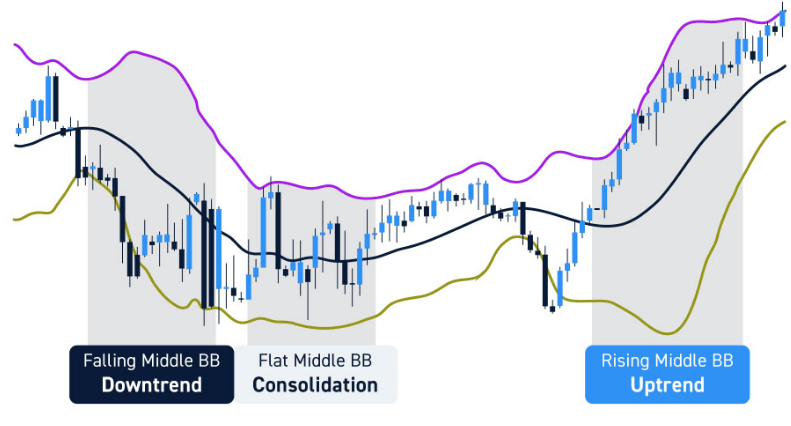
It’s an efficient intel which helps people to set long or short positions, depending on these values.
Identifying reversals
Another feature of this indicator is identifying cost reversals. For example, the valuation rises to the upper line or goes above it. It means that a downside reversal is going to happen soon enough which is based on the overbought condition of the asset. In case of the oversold, valuation decreased down until the lower line or falling below this border. This can be followed by a reversal to the upper movement. All this intel helps to correct and adapt trading strategies and risk management which can significantly impact on the possible income.
Determination of the overbought/oversold condition
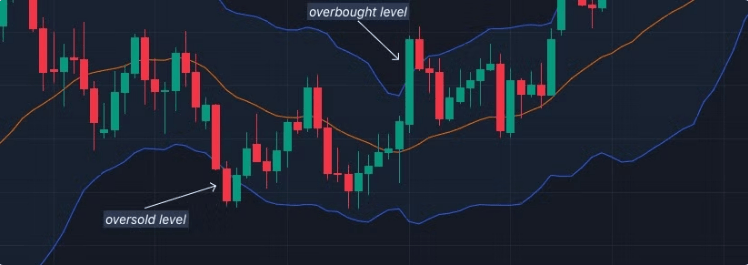
As it was said before, Bollinger bands can determine the overbought/oversold condition of the chosen security. Reaching or overstepping the upper and lower lines are potential signs of the overbought and oversold conditions, respectively. Based on this data, market players can sell during overbought and buy at the time of oversold. The instance below shows how these conditions look:
Technical tools which are in relation to Bollinger bands
Here are two indicators which are in relation to Bollinger Bands:
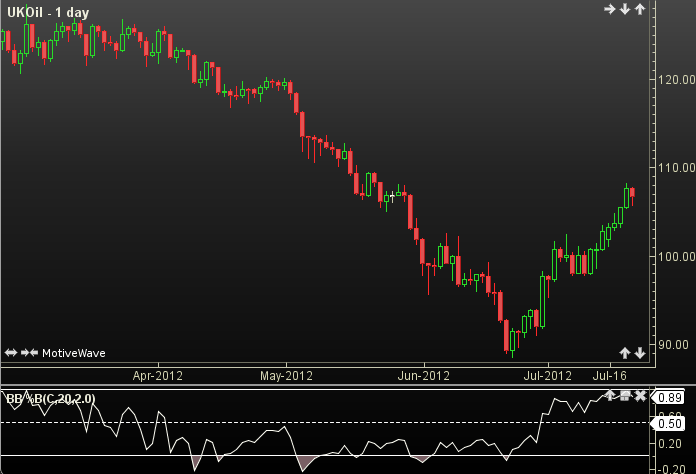
- Bollinger %B. It identifies the valuation position with regard to the Bollinger bands. IT improves the review by determining the potential overbought and oversold conditions of an asset. This tool shows if the cost approaches the upper or lower level. Here is the picture of this indicator in action:
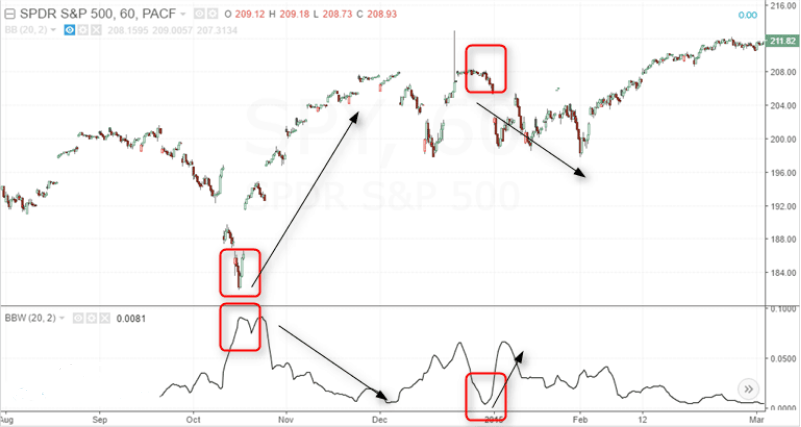
- Bollinger bandwidth. Main function of this tool is measuring the width of the Bollinger bands. Resulted value is viewed by a percentage of the SMA. It can provide market players with necessary data which helps to determine the period of increase or decrease of market volatility. Take a look at this technical tool:
Bollinger bands with additional technical tools
First of all, let’s review additional tools step-by-step::
- Popular complementary indicators: RSI, MACD and Stochastic oscillator. When you combine these tools with the Bollinger bands, the overall quantity of false signals decreases because of more detailed analysis.
- More detailed example: detection of sell and buy signals. RSI can additionally alarm you about overbought conditions and detect the buying point. On the other hand, MACD can identify and confirm the oversold condition of the asset and detect the buying signal.
Bollinger bands in trading
There are several trading strategies with Bollinger bands:
- “Squeeze”.
- Breakouts.
- Walk.
Let’s review them individually.
“Squeeze”
Basically, market players enter a long or short position after tightening bands, which is also known as “squeeze”. Such an event means the overall decrease of the volatility. Take a look at the example of the “squeeze”.
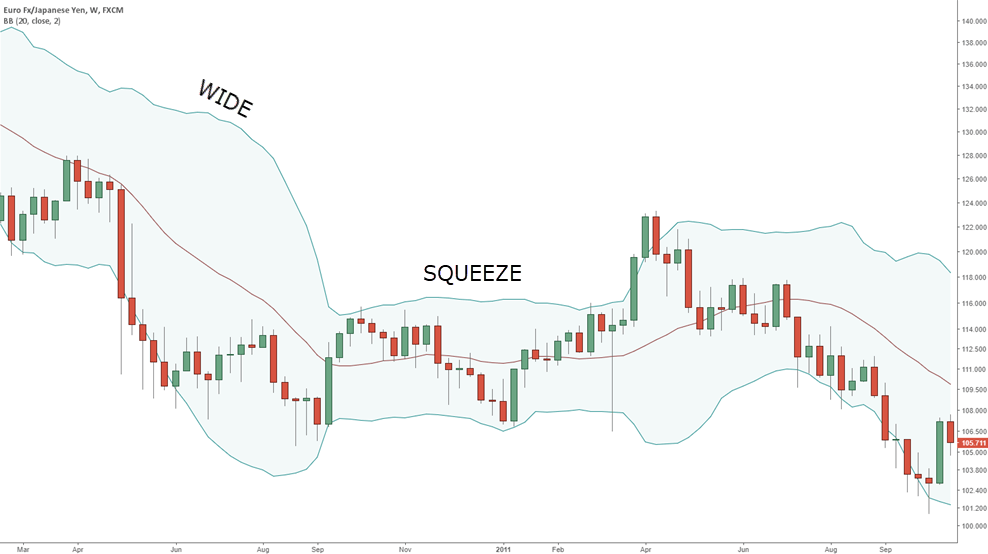
It is often followed by huge cost changes in the future. That’s why traders enter in these conditions at the time of that valuation’s leap which occurs on the bands widening.
Breakouts
Breakout strategy is based on the valuation’s movement above the upper line and below the lower level, respectively. It indicates a possible trend’s continuation which can help to adjust long positions in case of the strong uptrend and short ones during the powerful downtrend. Settings of risk management should be reconsidered: stop-loss orders may be put very close to points of breakout on each side: below and above, respectively.
Walks
Walk means a continuous movement on the upper or lower levels at the time of a strong tendency. It provides people with a big quantity of possibilities to enter and exit trades. At the time of an uptrend, market players can play long-term during the price’s bounce off the upper line. Calling out occurs when the valuation goes below the middle level (SMA).
Advices for reaching the best result
Of course, the indicator itself is useful, but you need to follow several advices to have the best result:
- Improve risk management: stop-loss orders, position sizing and estimation of the risks themselves.
- Adjust the indicator: set different values to adapt the tool to the market and your strategy.
- Combine Bollinger bands with other instruments. It helps to decrease the quantity of false signals.
- Be patient and stable. No need to rush: discover the best possible trade setup within your strategy.
- Be attentive and observe the action. Adjust your strategy if it fails to perform well enough and improve it by setting several changes which are compatible with the situation.
Benefits & limitations
Each tool has its pros and cons. Let’s start with advantages:
- Ability to measure volatility. It is a flexible tool which can increase the quality of received information about cost movements.
- Trend determination. Ability to identify the possible reversal is very crucial.
- Multi-functional. It can be used with a variety of assets and time periods.
- Bollinger bands are able to support mean reversion. It can show you possible trading opportunities within the range-bound markets.

Now, limitations:
- Bollinger bands are the lagging indicator. Sharp market movements can be discovered too late.
- False signals. It can usually happen within trending markets.
- It doesn’t give a clear view on the direction of the future cost movements. It occurs on the breakouts.
- Necessity in other compatible technical tools. The result can be blurry and not efficient enough that you should use additional indicators to clarify the data.
So, there are pros and cons of bollinger bands, which you can use.


