
Support is a regulator, which depends on buying shares at lower costs. This is a required action for the equalization between demand and excess of supply. Prices become lower and it attracts market players who are waiting for a more profitable outcome and it helps to stop the price’s downfall.
- Resistance – the definition
- Signs of levels in trading
- Trendlines
- Round numbers
- Moving average numbers
- Another signs
- Reversals
- How to trade support and resistance levels
- How to imagine levels
- Breaking levels and consequences
- Psychological aspects
- How does level form?
- FAQ
- What is the meaning of levels?
- Why does it form?
- Rules of level’s behavior?
- What is the level’s indicator?
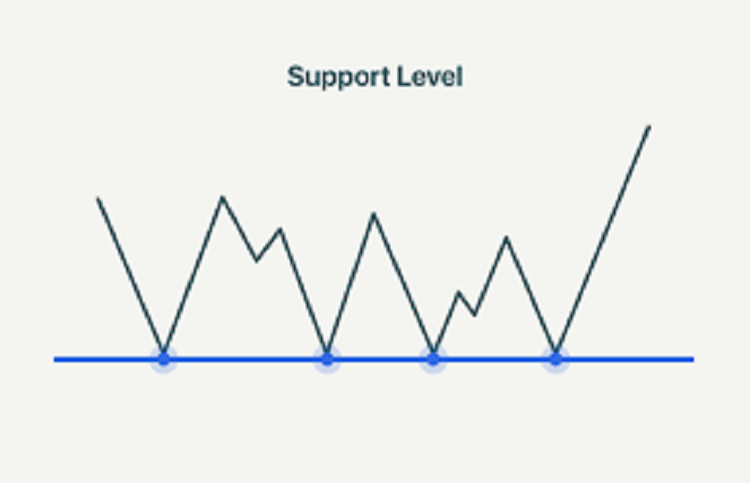
Support is situated on the graphic at the bottom point of the valuation line. Support is a sector on a valuation chart which shows investors’ desireness to buy. After this demand often overgrows supply, leading the valuation drop to stop and reverse.
Resistance – the definition
Resistance is an opposite term of support. Costs rise because of demand predominance over supply. With the price increase investors’ willingness to sell will overgrow demand. It happens because of several reasons. Market players can decide that costs are too great or they just reach their target line.
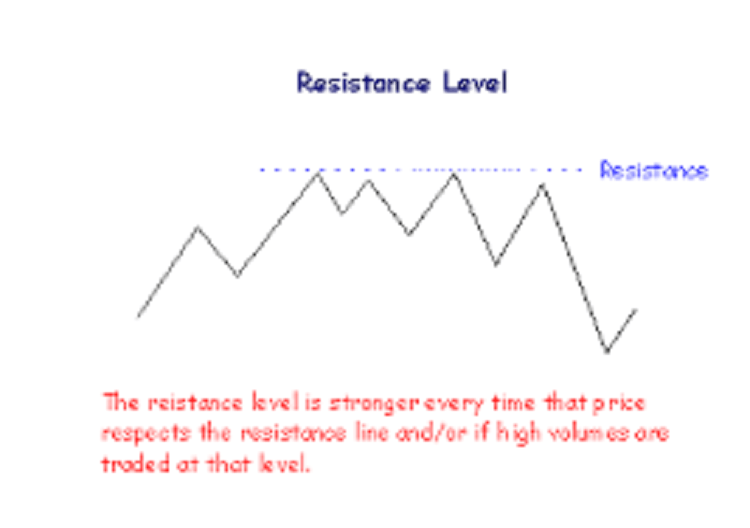
Another reason could be the lack of desireness to buy more positions at such high value. There are a lot of reasons for this problem, but a specialist will undoubtedly find a line on a cost chart, which follows the point where supply starts to overgrow demand. This is the resistance’s definition.
Signs of levels in trading
There are different indicators of these levels. For example: treadlines, round numbers, moving averages and more different signs. Take a look at it.
Trendlines
Valuation exists at a stable level which saves the price of assets from changing. This borderline is often used with resistance & support, but the cost of shares moves upwards or downwards overall and that’s why cost borders usually change throughout the time. That’s the reason to learn the concept of tradelines.

At the time of trending rising, resistance mark is created as the value changing slows and returns on the trendline level. If the cost is changing differently to the current trendline level it’s a reaction. It can happen for a big number of causes. Reaction can occur as a consequence because of profit taking or doubts about specific issues. It leads to the situation when the price action goes below a «plateau» effect.
Many market players will investigate the price of a security as it downfalls to the broader tradeline support because for a long time this has been a prevention of the asset’s value falling even further.
Round numbers
There is other usual side of support and resistance which includes an asset’s value having an issue of moving beyond a round number. It’s just much simpler for traders to think about round valuation, and this affects to stock market. The reason for this is just a basic human factor of thinking. It makes many new traders to trade assets at the exact time when the price is close to the round number.
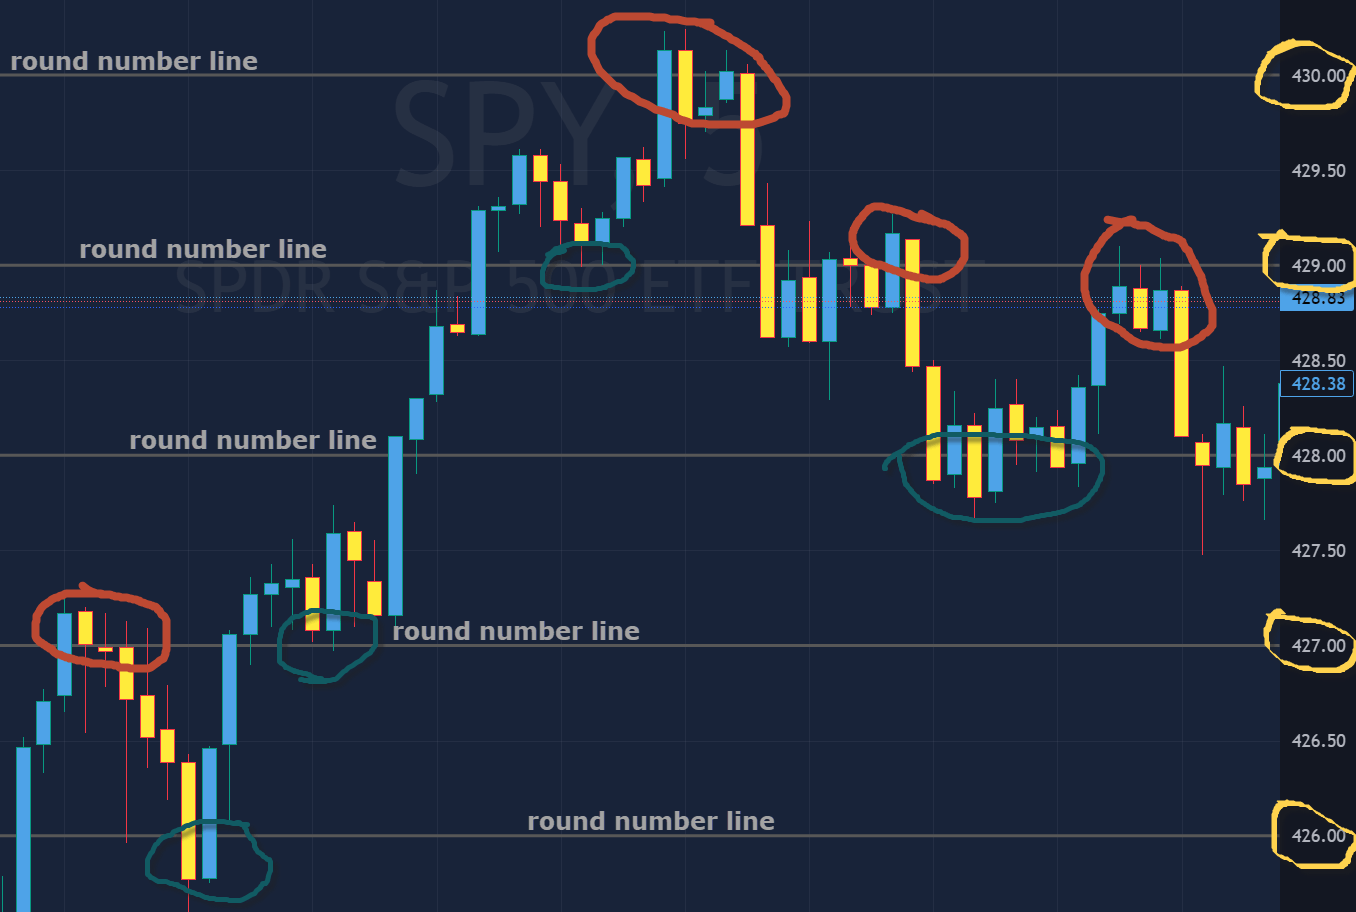
Moreover, lots of market players target prices or just quit orders from investors and banks because of their round valuation. As a result, lots of orders at the same costs leads these numbers to become a strong barrier. If all investors of an investor bank start to sell at suggested $100, it’d take an incredible count of purchases to devour these sales and that’s how a level of resistance could be created.
Moving average numbers
People can use this instrument in a lot of ways. For example, to predict moves upward if cost level crosses above an important average, or to leave trades when the value goes downward below average. Despite using average, it usually produces «automatic» resistance and support levels. Lots of market players will try variable time periods in their own averages to find the one that works best.
Another signs
Many signs of search assistance of levels were discovered and there are still more to come. One sign is situated on the valuation numbers, the second is more expensive or cheaper than the original value. It all can be hard to find in the beginning, so you need to prepare yourself and master the patterns. In fact, when you use a different style of searching for the levels, it still will be the same result, as if you find the line by trendlines or moving averages, which are, basically, easier to use.
Reversals
A former support level will sometimes become a resistance level when the valuation tries to rise, and oppositely, a resistance level will become a support level as the cost temporarily goes downward.
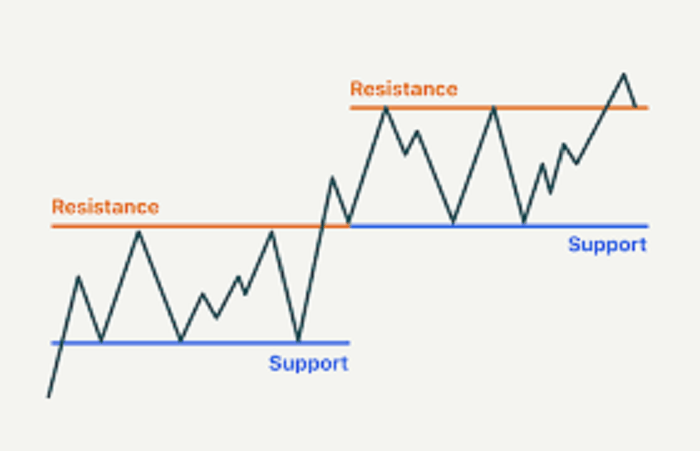
Price charts allow people to visually discover levels of resistance and support, and they give hints despite the significance of these valuation levels. Here’s the examples:
- Number of touches, which are based on increasing tests on support and resistance levels. It leads the level to become more significant. When valuations keep bouncing off a support or resistance level, more market players notice and will lean on this to make trading decisions.
- Preceding price move, which is based on market psychology. Support and resistance levels are often more significant when they are preceded by huge advances or declines. For example, a huge advance or uptrend will be greeted with more rivalry and enthusiasm and may be stopped by a more significant level of resistance than a slow advance. A slow advance, probably, won’t have as much attention.
- Volume at certain price levels, which depends on the amount of buying and selling. If valuation has occurred at a particular level, it will be met by the stronger the support or resistance level. The main reason behind this is that market players remember these costs and are encouraged to use them more. If strong activity will lead prices to downfall, a lot of people will usually sell the assets, because they would like to at least stop at an equal point of funds rather than potentially lose.
- Time, which has a great influence on support and resistance levels. If they are being observed in longer time period charts such as weekly or monthly charts are usually more significant than those which were observed for a shorter time frame chart such as the five-minute or ten-minute chart.
How to trade support and resistance levels
These are two ways of support and resistance trading:
- Trade the «bounce», which is, basically, buying assets when the valuation falls in the direction of support, and selling them if the cost moves upward to resistance.
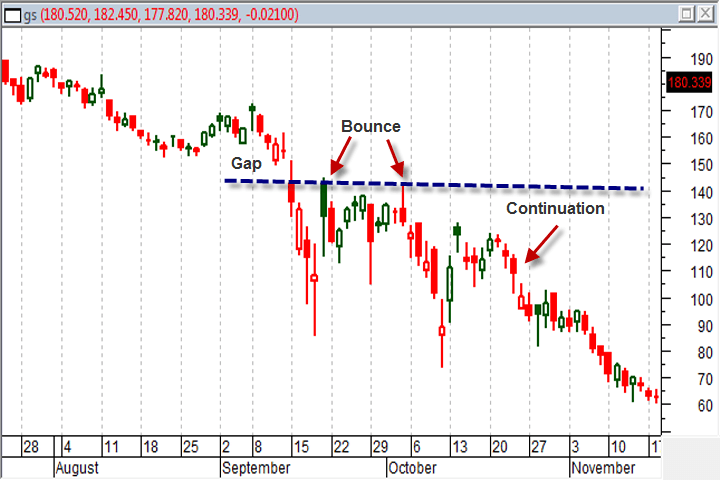
- Trade the «break», which means buying assets when the valuation breaks up through the resistance level and, of course, the opposite – selling them if the price breaks downward through support.
How to imagine levels
There are several pieces of advice that help you to improve and master the ability to figure out and draw support and resistance levels. These are:
- Paying attention to high and low swings in the market. It’s the base of drawing levels, because these can show you certain «key» levels, which usually show the appropriate time to buy or sell assets, depending on level.
- You can draw a level and it doesn’t fit 100% – it is not a problem. It is important to know that a human is not an AI and the most certain thing you need to follow is a number of touches on either side of the level. Time and patience is the key.
- Concentrate on the «key» levels in the market. Less obvious spots surely can be worth your time, but if you can observe a more specific level, which is far more stable and consistent, it’s the most profitable and comfortable way to trade.
- Follow a six-month window. Market players don’t need to overlook the past three or five years to discover resistance and support levels. Current levels are most likely shown for the past six months or less, so you don’t have to dig further down the field. Of course, traders can observe any points of time within a six-month window to collect the necessary amount of knowledge about levels.
To sum up, these advices will help you to use the advantages of the market to your own benefit. And it’s important to remember not to overreact and be consistent and patient, because psychology has a great influence on market actions overall.
Breaking levels and consequences
If Price breaks resistance or support level, it usually shows that some huge changes can start in the market.
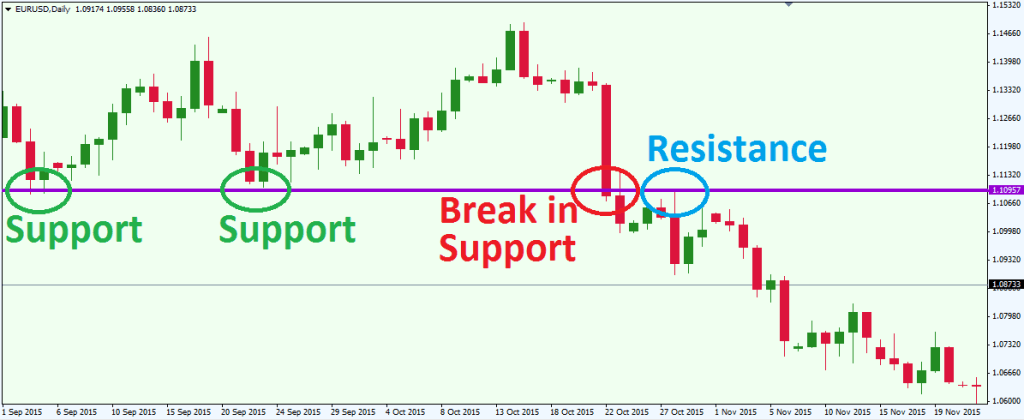
That’s pretty much what happens with:
- If valuation breaks support, it can follow a future price decline. Breaking the support shows a possible shift in control from buyers to sellers. Market players can choose to go short.
- If valuation breaks resistance, you already follow the point, it’s the opposite move. Breaking usually leads to a huge leap upwards, which shows that buyers are in charge of asset’s price at the time. People often choose to go long.
Psychological aspects
There is a huge human factor in trades, which, of course, influences levels and the market overall. Here are typical motivations for both sides:
- At support, buyers think the asset’s price is too low and believe in its potential, so they buy it. These people create a demand.
- At resistance, sellers think the asset’s valuation is too high, so they sell it. These doings increase supply.
How does level form?
These levels form because of huge differences between supply and demand.
An opposite story states if many traders start to sell assets, which, furtherly, create an abyss between the demand and supply. It leads other traders to discover the support level, at which they believe the asset will overgrow its initial value on the level.
FAQ
What is the meaning of levels?
Levels of support and resistance are indicators of supply and demand of assets on the market, which are based on human psychology.
Why does it form?
These levels form because of selling and buying at certain points of time and price of asset. As more people discover support and resistance levels, more stable these levels become.

Rules of level’s behavior?
At the support level traders buy an asset. On the opposite, market players sell an asset at the resistance level.
What is the level’s indicator?
Of course, there are several indicators to draw key levels of support and resistance, but there is no guarantee that you will draw a perfect line, that’s why you need to have more experience and patience to have a close look at the assets changes. It will significantly improve your skill and, potentially, your profit.


