
There are many useful technical tools to use within the trading operations, but let’s take a closer look at the Tick Index – an indicator which goes the market hand-in-hand. Is it that good enough – let’s discover the necessary information.
- Tick Index – what is that exactly
- Its Formula
- Tick Index as a tool for trading
- Observation for the Market Sentiment with this tool
- Trading Strategies with it
- Scalping
- Trend Following
- Trading Range Breakouts
- Divergence
- Q&A
- The definition of Tick Index
- Example
- Usual trading strategies
- Calculation
- Question about Tick Index versatility
- Reliability
Tick Index – what is that exactly
It is a technical instrument for calculating the net quantity of stocks which are increasing in price against those which are decreasing. By analyzing the New York Stock Exchange (NYSE), Tick Index interprets the momentum of the stock market.
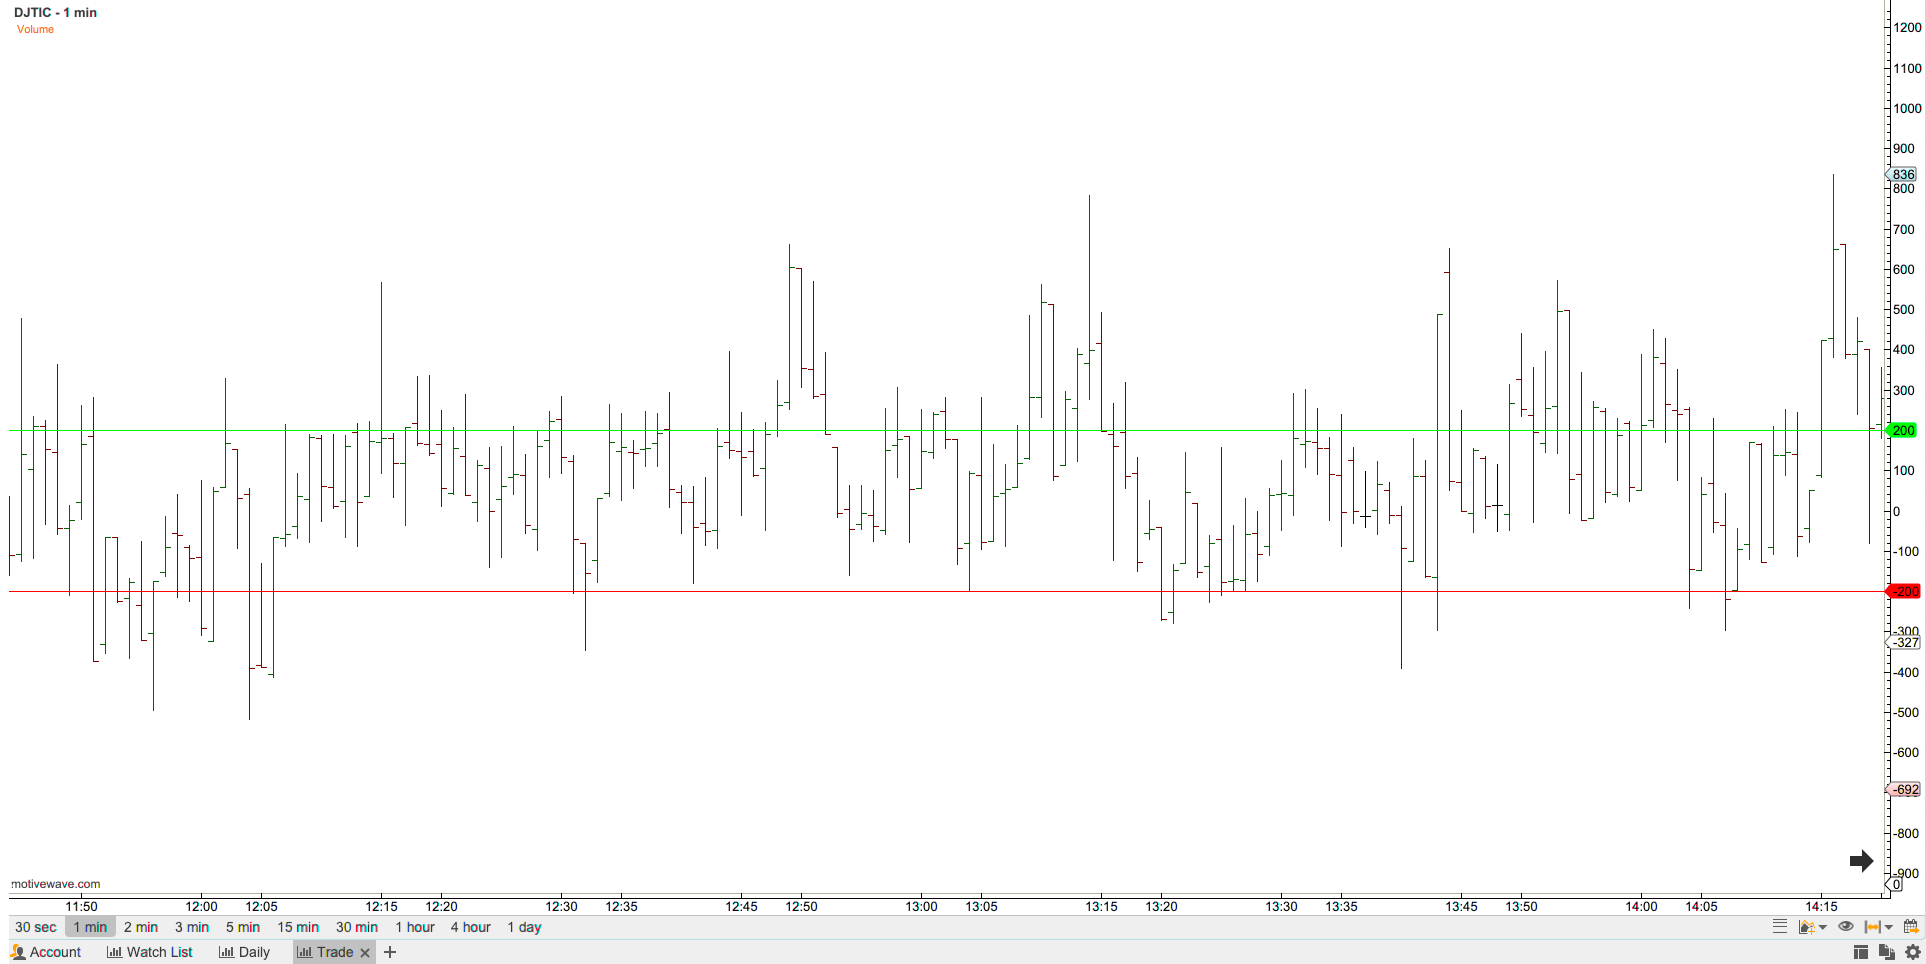
The values of the tool show the current dominant direction of the market decisions: buying, if the value is positive and selling, if it is negative. Moreover, it shows the points of overbought or oversold conditions. Here’s a visual example of the Tick Index’s chart:
Its Formula
First of all, let’s take a look at the calculation process:
- The number of stocks which were sold on downsticks are subtracted from those which were sold on upsticks.
- The result of the calculation is added to the previous value.
- Obtained data is constantly changing by the overall fluctuations within a day.
The higher the volume of the trades – the bigger number Tick Index will have. Gathered data shows current trend, liquidity level and the possible solutions of several problems with decisioning of the next trading move.
Tick Index as a tool for trading
Let’s review the fields of Tick Index’s usage:
- Rangebound market. Within this specific market this tool helps to identify right entry and exit points. The basic principle: values below -1,000 are for starting the trades for a long shot by buying the asset, values higher than 1,000 means the exit point.
- Trending market. The value can be stable and withstand numbers above and below zero for a long period of time which is defined by the existing trend. Uptrend with a certain pattern can be an entry point even if the values are near zero. Same story with the converse situation.
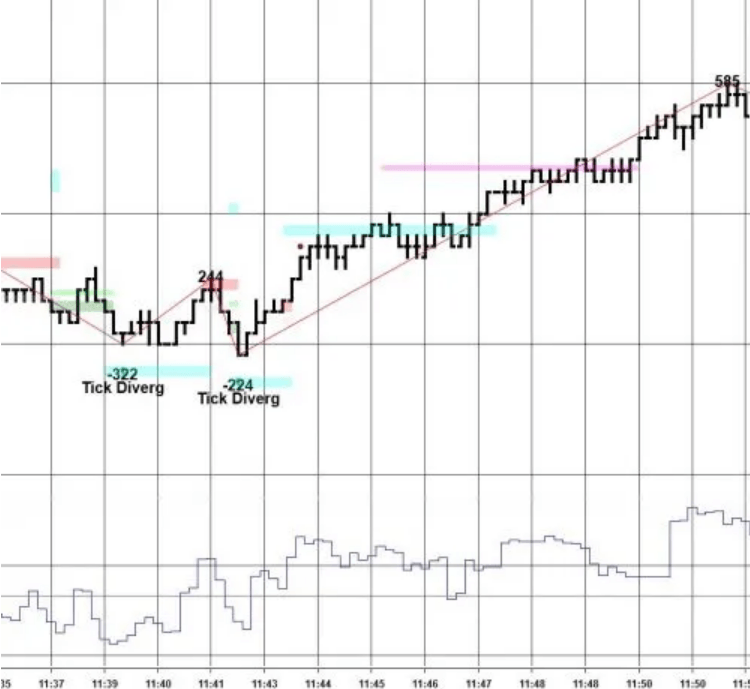
- Divergence between the instrument’s results and cost itself. It helps to determine the fundamental force of a market. Let’s take a look at the instance: tick reaches higher lows than stock’s cost which shows the weakness of the sellers strength. The opposite happens if the valuation makes higher highs than the tool – buyers are losing the grip. Take a look at example of the determined divergence by this instrument:
Observation for the Market Sentiment with this tool
Let’s systematize the possible gained knowledge from the Tick Index to interpret it with a market sentiment:
- The Accumulation/Distribution Line. The value of indicator is a visualizer of the situation: Zero is the Accumulation/Distribution line, the lower numbers stand for a negative market and the higher ones mean the positivity of the sentiment. Let’s review the visual example of the index where there are both positive and negative market conditions:
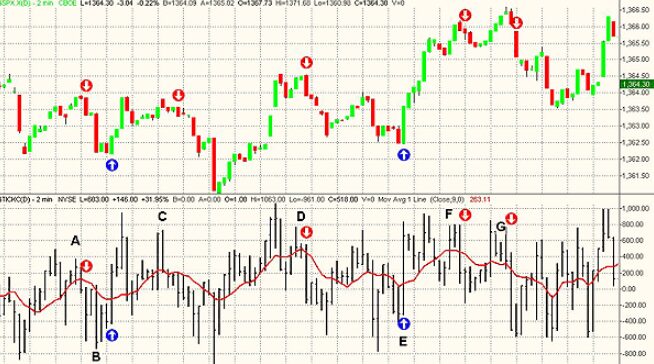
- Signals. The synchronization between the market momentum and the Tick Index is the most optimal condition to identify the entry or exit points of trading. This exact condition means the strong tendency which increases the chance of a profitable outcome.
The Tick Index can provide you with the knowledge about existing market sentiment, but you need to be precise to get the right result without several miscalculations.
Trading Strategies with it
There are several ways to use the Tick Index in trading – let’s review each one individually.
Scalping
Take a look at the features this tool gives within the Scalping strategy:
- Identification of the possible trend reversal.
- Finding the overbought/oversold condition.
- Quite cooperative with other indicators – it can confirm trading signals from them.
- Ability to perform several trading moves during very short periods of time: even seconds. It gives a profit from small valuation fluctuations in every single move.
Here’s the example of the Tick Index’s chart which helps to identify support level and useful with the scalping trading strategy:
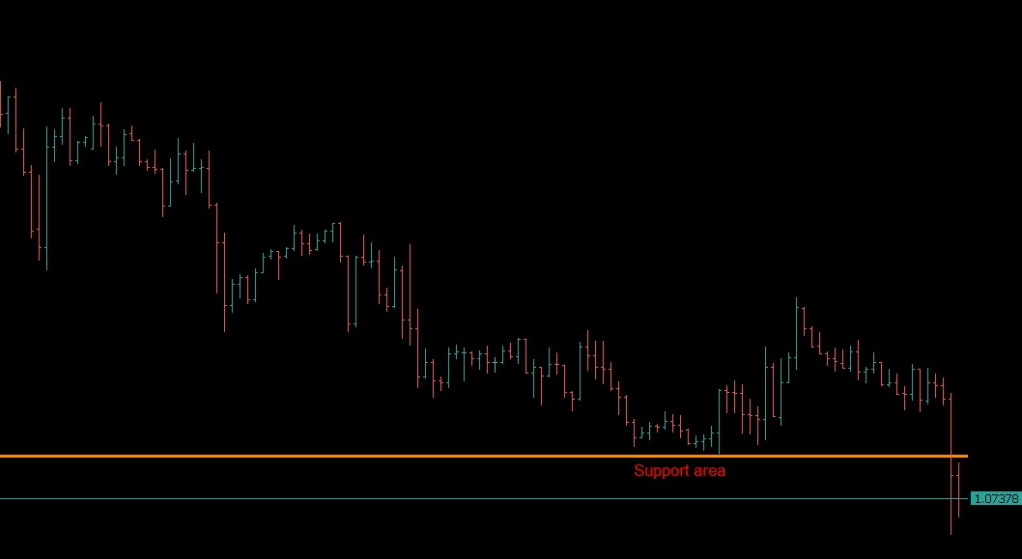
To perform on such a scale you need to be qualified and have an indeed good reaction. It is recommended to have an experience before trying this risky strategy.
Trend Following
If you choose the trend following strategy – Tick Index can increase the chances of a best possible outcome. The ability to determine the amount of buying or selling pressure is crucial while trading this way.
Here’s a colored visualisation of the Tick Index which shows both sides of the market sentiment:
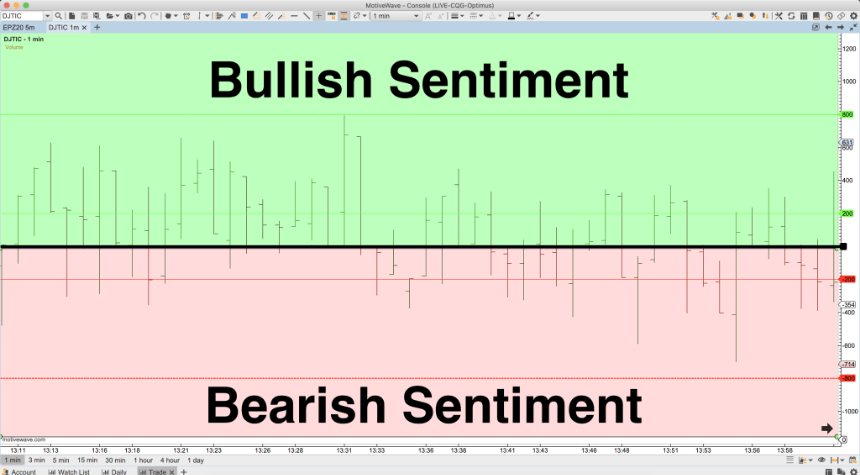
It’s a very efficient combination between the Tick Index and Trend Following, because the tool itself is very compatible with other technical assets which can be used to have a wider picture of the market. Of course, everyone should be aware of the risk-reward ratio to be more prepared and less greedy.
Trading Range Breakouts
This type of strategy involves a certain pattern of moves which needs to be executed. In case if you follow them you can receive a potential profit. Let’s take a lot at them:
- Make a continuous observation for the market. Watch for the charts, determine and monitor existing trends. It would help to identify support/resistance levels of the asset.
- Find and confirm breakout zones. After you receive the data from the observations – identify a trading range breakout where the volume of the stock is increasing and look for the ticks which go more far than the determined changes of the price.
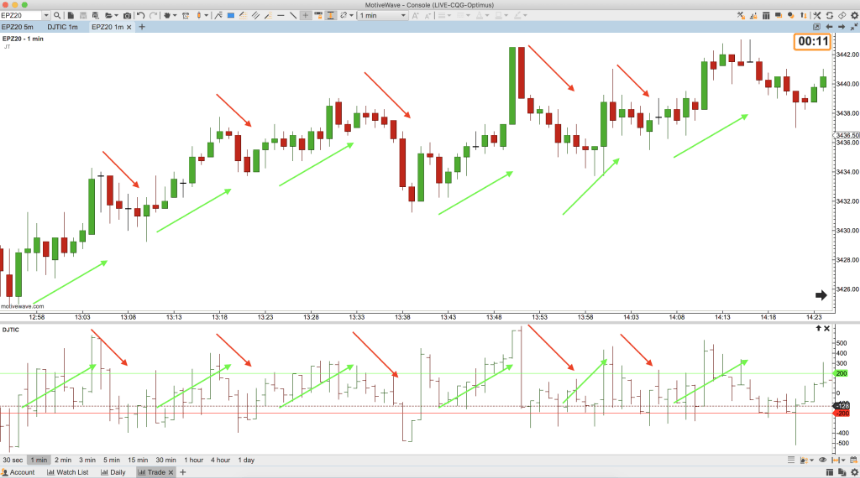
- Make sure that the trend exists – confirm it with the Tick Index. Take a look at the market and the index valuations simultaneously at the ideal time of making a trade during a breakout. Adjust the strategy after you get the received data.
Take a look at the necessary level of synergy between the index and the market:
- Don’t be in doubt – if the decision is based purely by technical measures and analyses, the result will be good.
Divergence
As in the previous case, you need to be aware of certain rules and be sure to follow the right sequence of action:
- The trend confirmation. Firstly, receive a clear sign from the Tick Index to identify the trend and make sure of its stability.
- Look out for the possible divergences. Observe the data of the valuation changes and relate it to the Tick Index numbers. Find the dots to connect and find the potential divergence.
- No market moves until the confirmation candles. It’s crucial to ensure that the divergence is occurring by discovering the duo of candles which can confirm the divergence’s existence.
- Perform a trade. After all the preparations and confirmations you are free to execute the buying/selling.
In addition, don’t be afraid to check yourself by using different indicators. It’s right to ensure yourself that the decision you are about to make is right. MACD or moving averages are optimal in cases of the divergence trading strategies.
Q&A
The definition of Tick Index
It is a technical tool for measuring the quantity of stock valuations which are rising or falling down in a market. By identifying the existing market sentiment with this instrument, market players make several trading moves.
Example
For instance, there is a NYSE Tick Index which intention is to measure the relation between increasing and decreasing stocks. Numbers above zero stand for prevailing upward movements. Conversely, a value below zero means the dominance of the downward force.
Usual trading strategies
The usual strategy with the Tick Index involves the divergence and its identification. The other usual way to apply the indicator lies in the usage of its extremes as a contrarian signal which means the buying at the lowest levels of the index and selling at the highest.

Calculation
The value of the index received after the subtraction of the downward moving quantity of stocks from those which are rising up. The number you got from such calculations is added to the previous indicator’s numbers.
Question about Tick Index versatility
It is indeed a useful tool on different platforms. For example, on Forex or Futures. But, the Tick Index must be calculated individually for each of them because it has its own different formulas for the variety of the markets. It means that you need to adjust the indicator for the conditions of the chosen market.
Reliability
It is most useful in cooperation with additional indicators. Because of its limitations, several results need to be confirmed by other tools to ensure that the received intel is good enough to operate with.


