
There are different methods to operate trades, but not all of them are efficient enough. Let’s take a look at one of the most useful tool in the trading arsenal – time frame.
- Trading Time Frames: The definition
- Reasons of its importance
- Types
- Swing trading
- Day Trading
- Scalping
- List of best frames
- For scalpers
- For day traders
- For swing traders
- Benefits & drawbacks of different types of frames
- Factors affecting the choice of time frames
- Multi-time frame analysis
- Instance of trading with multiple timeframes
- Q&A
- Usual time frame for position trading
- Swing traders choice of time frames
- How to pick a time frame
Trading Time Frames: The definition
Short-term market players operate depending on the intel from the platform they trade on. Trading time frame is one of the most efficient ways to collect the data about the security’s valuation’s changes. The most usual choice in visualization of it is a candlestick chart graphic. It provides traders with the knowledge of asset’s opening, high, low and closing cost.

Moreover, experienced market players interact with multiple frames. It cleans the overall picture from small and meaningless fluctuations.
Above all, smart traders use multiple time frames to help separate the signal from the noise in an asset’s price movement.
Reasons of its importance
Let’s review the aspects which explain the importance on time frames in trading:
- Providing the decision’s speed increase. In the market, it can seriously affect the outcome. It also helps to identify the borders of the time period you intend to work for. Short-term traders are in search of reward for the right use of constant valuation’s volatility. On the other hand, long-term market players dive deeper and for a significantly longer period of time. They analyze the patterns throughout months or years to get the desirable result.
- Discovering the entry and exit points. Intraday charts for short-term periods and wider fluctuations with the bigger chart for long-term traders.
- Time frame is a great instrument to improve the understanding of market dynamics which provides each type of trader with additional knowledge: trends, swings and more.
- An observation for the market behaviour. It helps to improve the investment strategy considering all the changes.
Types
Let’s take a look and learn about short-term trading types.
Swing trading
This type is based on a longer game in short-term conditions. The length can reach several days or weeks. That’s because of using a daily frame time.
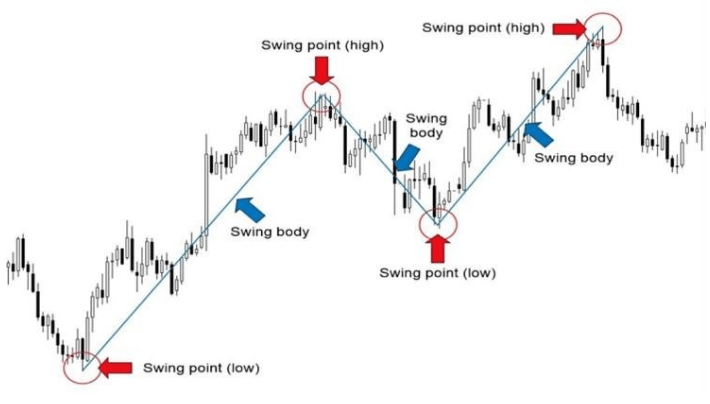
The decision of these traders should be based purely on the intel they’ve got without human factor. Every “swing” must be treated correctly. Here’s a review of the swings on charts:
Day Trading
This is a faster way to trade. People operate within the 4-hour time windows throughout the day. The intention is to play on trends to gain quick profit. Quantity of trades can be large because of the chosen asset’s constant volatility. Stop-loss orders are included in risk management. And the prudent position also reduces the loss.
Scalping
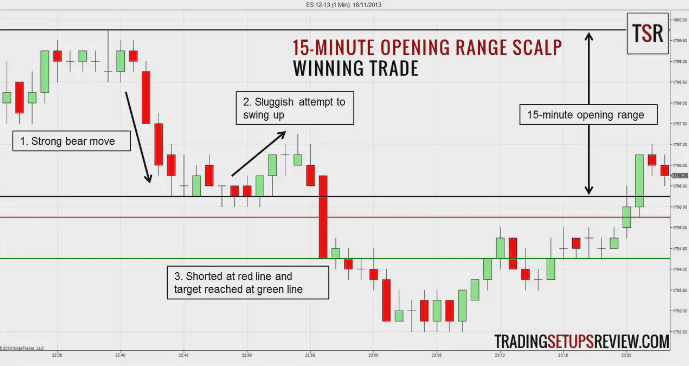
Definitely, the quickest way to trade. Time frames are very short: 1,5 and 15 minutes are all used by scalpers to open and close the deal.
Here’s the example of the profitable scalping:
List of best frames
Each of the presented trading types are performed within specific time frames. Let’s take a look at them.
For scalpers
Scalpers charts:
- 1 minute (M1) chart. The most usable for scalpers.
- 5 minute (M5) chart. Signal-to-noise ratio is way better than the 1 minute chart. It is used for a quick search for short-term trends.
- 15 minute (M15) chart. The most detailed frame in comparison to the shorter ones.
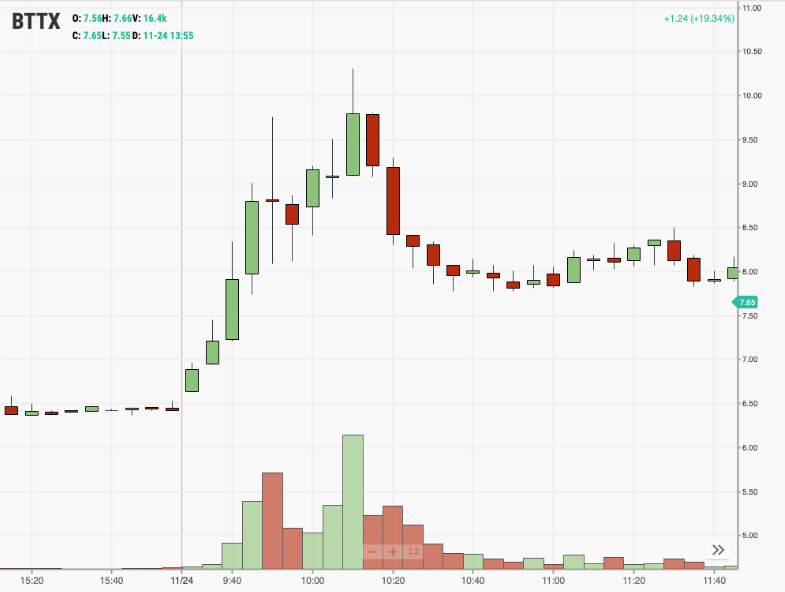
Let’s take a look at the picture in order to visualize M5.
For day traders
Intraday traders charts:
- M5. These are the pillars for entry and exit points. Identification of trends can be provided with such charts
- M15. It helps to clarify the overall market trends. It can be connected with M5 to confirm trend signals.
- 30 minute (M30) chart. It is a very important time frame for future trades which can last for hours. Great perspective on support and resistance levels is the guidance.
- 1 hour (H1) chart. It is a useful time frame for bigger charts and the observation for the daily valuation fluctuations.
For swing traders
Swing traders charts:
- 4 hour (H4) chart. The lower border of time frames which are used by such traders. Identifying entry and exit points in addition to the daily price’s changes help much all-together.
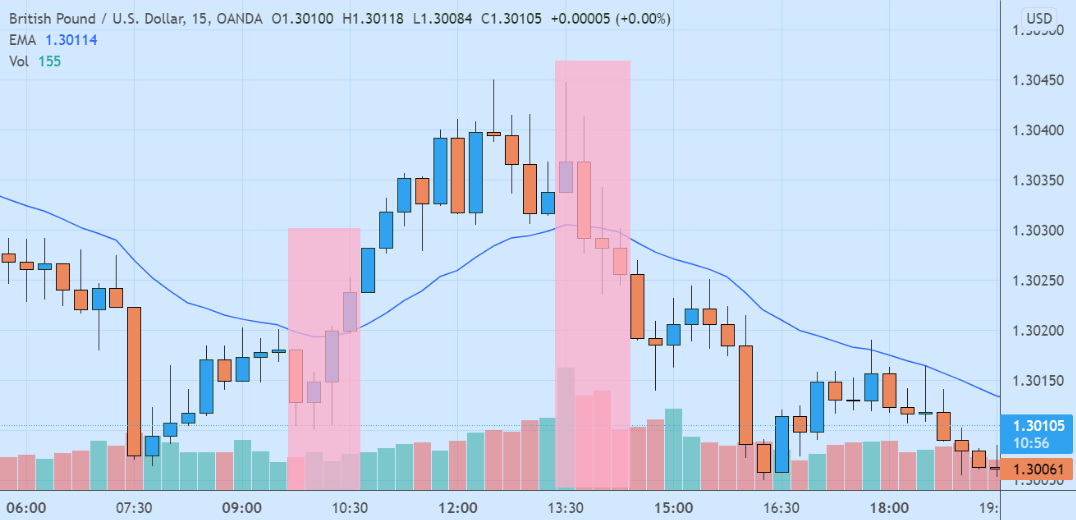
- Daily (D1) chart. This chart provides traders with the view of the potential overnight large swings. Here’s the example of D1:
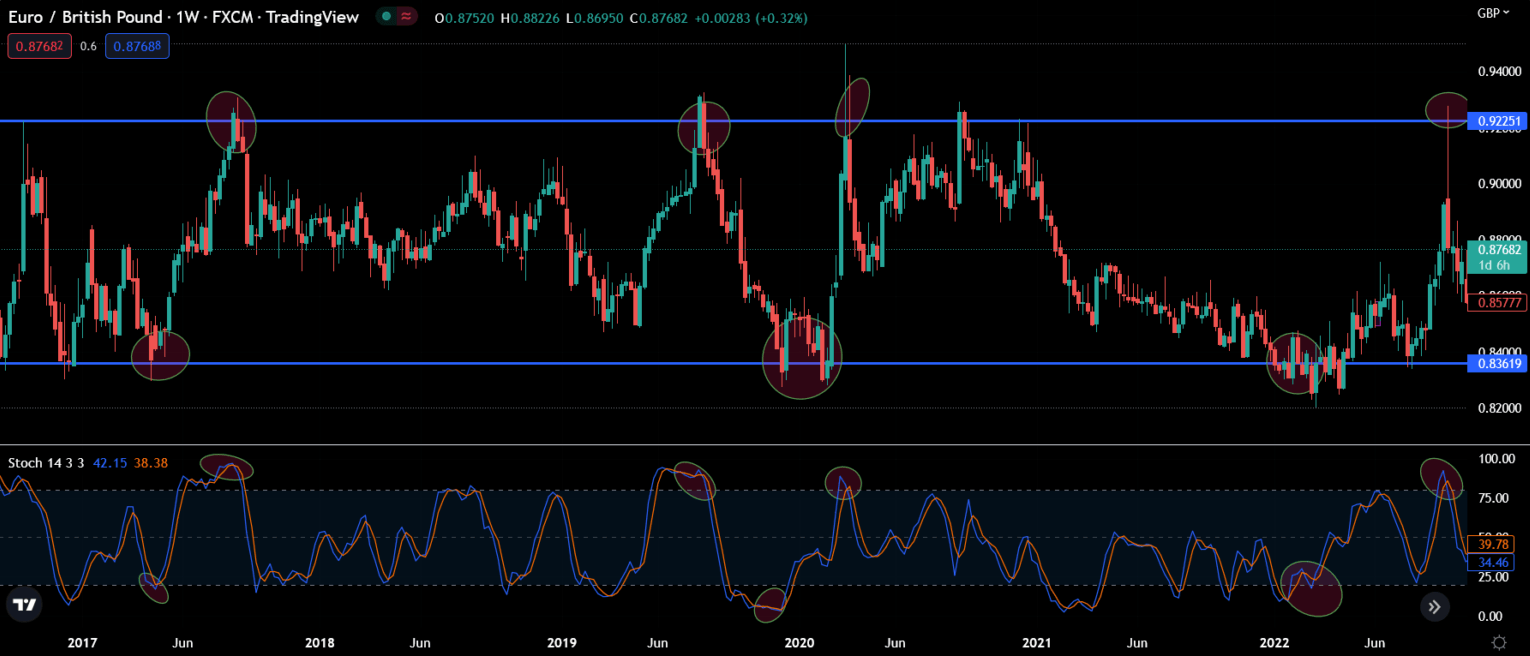
- Weekly (W1) chart. It can be very useful to find support and resistance levels on a bigger scale – out of the daily time period. Let’s review the instance of W1:
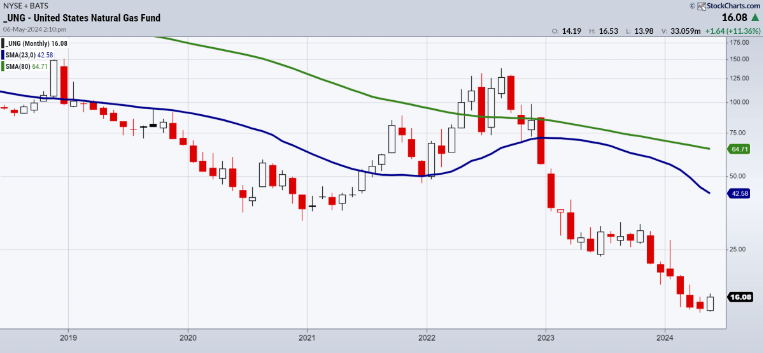
- Monthly (MN) chart. The largest time frame for short-term trading. It is widely used for the most detailed analysis of the market by swing traders. Here’s a real-life example of MN:
Benefits & drawbacks of different types of frames
There are certain advantages and disadvantages of different time frames. Let’s review each trading frame:
- Long-term.
Benefits: lower risk, profit from trends and a more calm approach because it doesn’t demand constant observation.
Drawbacks: higher expenses due to its longer periods.
- Medium-term.
Benefits: ability to operate with larger valuation fluctuations, protection from false indicators.
Drawbacks: higher risk and less opportunities to trade than during short-term trading, constant self-control to avoid short-term temptations.
- Short-term.
Benefits: softer risk, intraday opportunities.
Drawbacks: more transaction fees, continuous observation, false trading signals.
Factors affecting the choice of time frames
Before entering the market, you need to remember about certain factors which directly affect the result:
- Risk Tolerance. Short-term conditions must be followed by tighter stop-loss orders. On the other hand, long-term conditions have more space to operate, but require wider stop-loss orders.
- Experience. You need to be smart and have enough knowledge and reaction to operate fast. New traders can try long-term time frames first. Short-term conditions are too volatile for the beginner to handle.
- Trading strategy alignment. You need to adapt the chosen time frame to the trading strategy. Use technical analysis for short-term trading and fundamental analysis for longer-term conditions.
Multi-time frame analysis
Multi-time frame analysis works to identify all the different movements of an asset. This tool helps to gather and sort all the necessary knowledge to improve the overall intel you have on the observable asset.

It analyses the parameters of chosen stock on several charts: H1, D1, W1. These observations offer a view on overall trend and smaller valuation fluctuations.
Instance of trading with multiple timeframes
Let’s review the example of swing trading used with multiple timeframes:
- W1. Determine the prevailing overall trend: if it is bullish – you should buy.
- D1. Time to improve your strategy. Support levels give you several hints for the choice of stop-loss orders placement. Resistance levels, on the other hand, will show you the price’s potential struggle spot. D1 is the best for choosing the entry and exit points.
- H1. Look deeper, add more details to your trading strategy. Search for the particular patterns of cost changes like breakout, for example to ensure the entry point. Right after such a pattern appears – make a move, depending on the alignance of the trend and your own risk management system.

It works not only with swing traders. Day trading can be conducted in Day-Hour-Minute setup and trades in long-term conditions can be executed within a Month-Week-Day system.
Q&A
Usual time frame for position trading
Position trading works efficiently in cooperation with daily, weekly and monthly charts. The longer-term conditions explain this choice.
Swing traders choice of time frames
The usual choices in that case are: H1, H4 and D1. These time frames allow you to identify price swings throughout a week. It keeps the balance between the volatility of short-term trading and deep trend analysis of longer-term conditions.
How to pick a time frame
You need to remember that it is an individual situation. Think about your risk tolerance, review the level of experience you have and align time frames with your own strategy. Try to apply all parts in the trading model to verify the correctness of the approach.


