The volume oscillator is a very useful tool in good hands. Let’s discover the instrument itself, its upsides and downsides, compatibility with other indicators.
- The Volume Oscillator (VO): The definition
- Working principles
- Market’s condition understanding
- VO in technical analysis
- Main specifics
- What do signals mean
- Calculation
- Best VO types
- Chaikin money flow (CMF)
- Volume weighted average price (VWAP)
- On-balance volume (OBV)
- Klinger oscillator
- Accumulation/distribution line (ADL)
- VO in trading
- Strategies
- Divergence trading
- Trend confirmation
- Breakout trending
- Volume spike trending
- Advantages
- Drawbacks
- Usual mistakes
The Volume Oscillator (VO): The definition
The volume oscillator (VO) examines the connection of the trading volume and valuation changes. It is a useful indicator which is based on two moving averages (MA) of the both volumes. It suggests the helping hand in predicting the potential changes in the market.
The VO acts like a regulator in decision-making situations. It can give you the identification of certain changes. For example:
- Discover the influence of both the buying and selling sides.
- Sense the divergence.
All-In-All – indicator, which gives you the signs of a potential tendency’s reversal and confirms the current trend’s consistency.
Working principles
The VO measures the distinction between two MA, which are trade volume and valuation movement respectively. It uncovers potential changes in the market and gives a perspective on future market moves. There are two stages:
- In the beginning you need to calculate two MAs. Usual MAs are short-term and long-term. As you discover from the name, short stands for the small time frame and long is about the big time frame.
- The second stage includes measuring the differences between MAs. It gives you the clarification of a potential reversal: divergence or convergence.
Market players predict possible tendency reversals or confirm the current one by comparing volume distinctions with the valuation’s movements. In case of VO and valuation changes diverging, tendency reversal is unavoidable.
Here are examples for each side of the story:
- Weaken bullish tendency: cost rises whilst volume decreases. It is a negative VO.
- Weaken bearish tendency: cost decreases whilst volume increases. It is a positive VO.
Market’s condition understanding
As you can see, VO is a measuring device of the relationship between valuation and volume. It makes him on the instruments which helps to provide the information about current market’s condition – market health indicator. These tools give you a view model of the market with all its changes which can positively influence on the trader’s possible decisions.
There are two states of market in case of measuring with the VO:
- Bullish. The leading mood of the market is buying.
- Bearish. The leading mood of the market is selling.
The VO gives you a perspective on the market’s conditions and it could be used with other health indicators. It will improve the quality of all the gathered data and increase the chance to have a good income.
VO in technical analysis
The VO is gathering data about volume and valuation change’s relationship. It makes the VO a perfect example of a technical analysis process. The are several main sides of this tool’s usage:
- To find a possible trend reversal. Let’s review an example. If the cost is higher than the VO’s value, it is the signal of reversal in trends. It means the weakening of the buying power and the future dominance of sellers.
- To measure and confirm the speed of the cost changes. If the VO’s values are compatible with the actual price change’s value, it is a proof that the current trends withstands for more in the future and is still powerful.
- To inspect Higher Highs and Lows respectively. It is connected with both support and resistance levels. For instance, if the VO gives a double bottom to create a Higher Low, the Volume Oscillator’s value will, eventually, reach the 0. It means the point of support and the reversal in market trends.
Main specifics
The VO has specific features. Let’s name all five of them:
- Measuring speed. It compares the volume over short and long previous time frames.
- Discovering divergence.
- Oscillation near zero. Higher and lower – overbought and oversold, respectively.
- Simple to interpret. The VO has a great visualization on a graph with more clear trading signs.
- The VO has flexible parameters for customisation. You can adjust it depending on your own wish and way of trading.
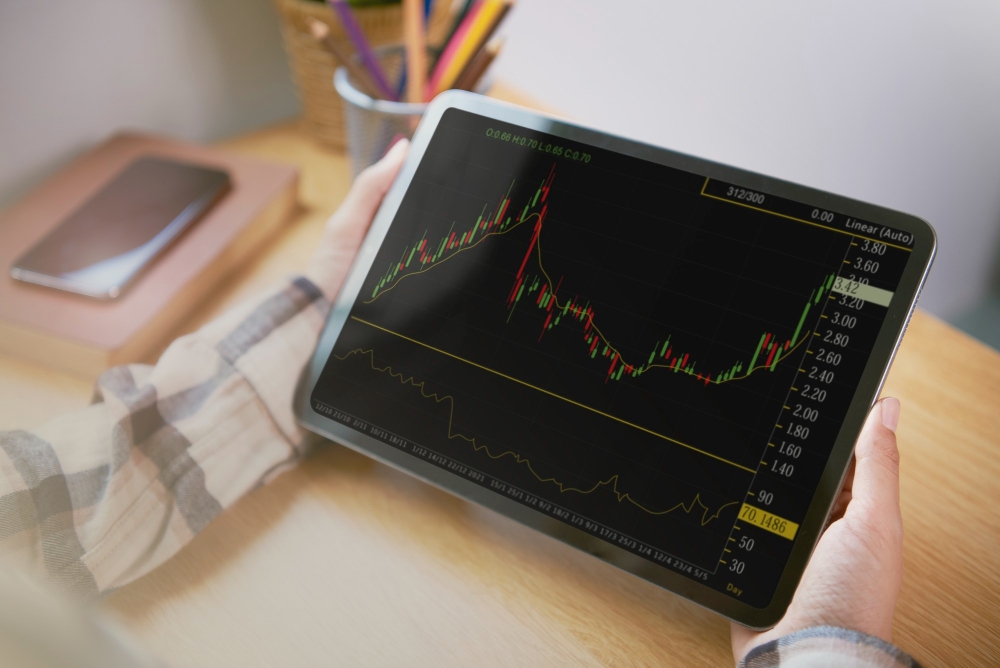
All of its features help to understand the significance and usability of itself. This tool improves all the potential profit of the trader, if it is used correctly.
What do signals mean
This instrument is indeed helpful, but in order to maximize the information it gives you need to have the right perception of its signals. To start with, there are two types of signals:
- Positive signal. The VO, in this case, shows that buying tendency is growing which means the bullish movement of a market.
- Negative signal. On the other hand, it shows the selling tendency’s future domination and intense growth.
Market players usually search for the divergence between the VO and cost. The VO has lower High than the cost’s High – the potential reversal is ahead. Moreover, traders also use other technical tools to validate the information. For instance, VO’s positive signal with a bullish moving average (MA) crossover. It gives a strong approval to the current market’s tendency.
Calculation
Let’s review the VO’s formula:
Both MAs can be flexible in values, because it is based on a personal trading preference. But you need to be sure that the chosen value is appropriate enough for the observable time frame to give the most reliable result.
Best VO types
The VO can be helpful enough, but there are 5 variations which give the best result overall. Let’s take a look.
Chaikin money flow (CMF)
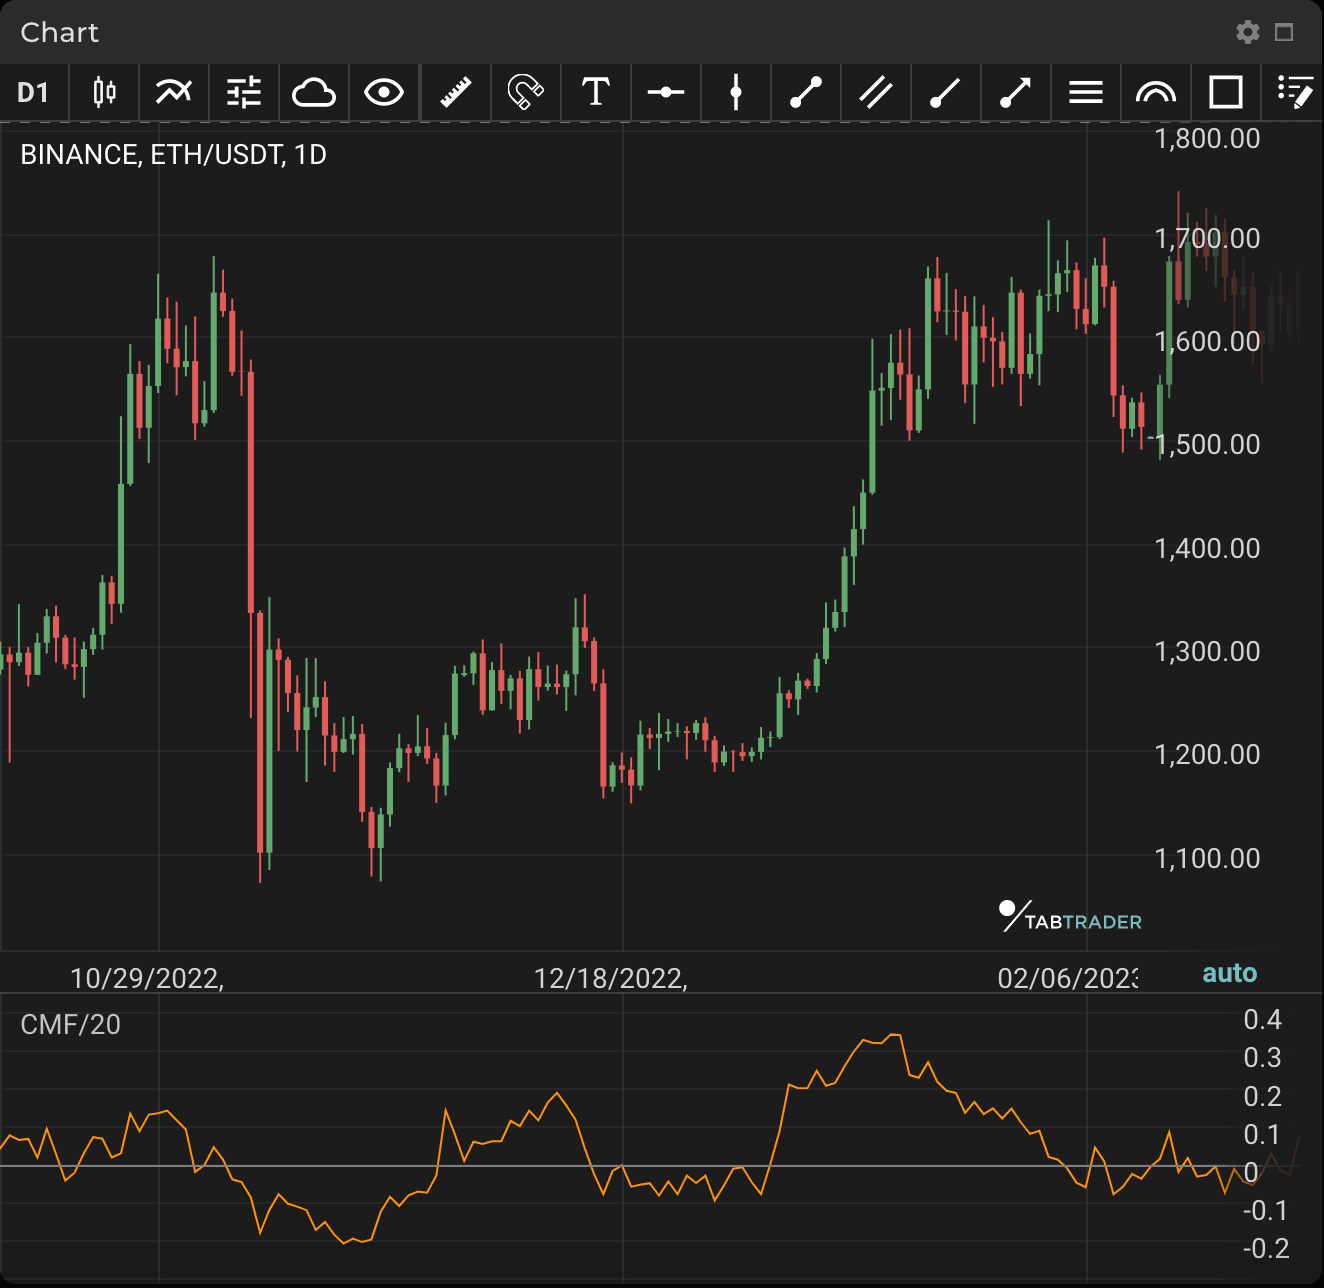
CMF, also known as Chaikin Oscillator, is the technical tool which involves valuation and volume information. This instrument discovers the asset’s condition: accumulation or being distributed. It is based on calculation of difference between two MAs of the Accumulation Distribution Line (ADL). This indicator gives a perspective on a current trend: whether it’s staying or reversing in the future. It shows overall data about the amount of buying and selling in the observed time frame.
Volume weighted average price (VWAP)
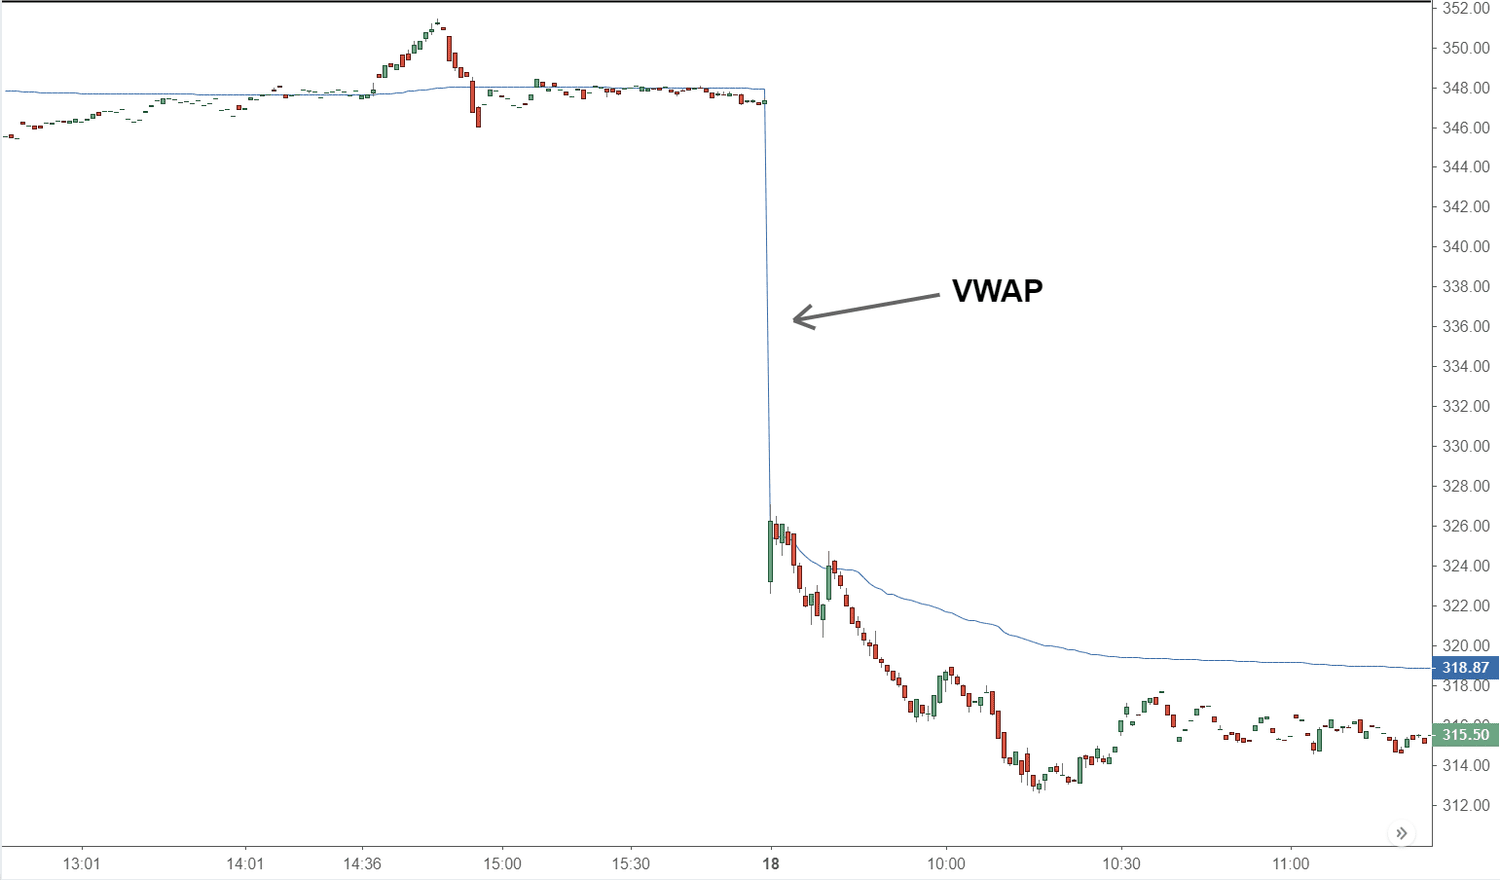
VWAP is a base trading price of an asset within the market throughout the observable time frame, weighted by the volume of every single cost level. It is calculated by accounting for cost and trading volume. VWAP is widely used with an intraday strategy. It provides the information for a trader’s strategy and setup.
On-balance volume (OBV)
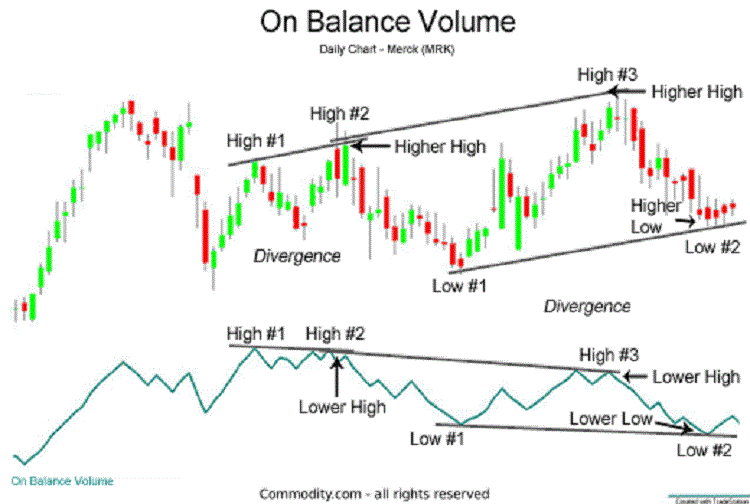
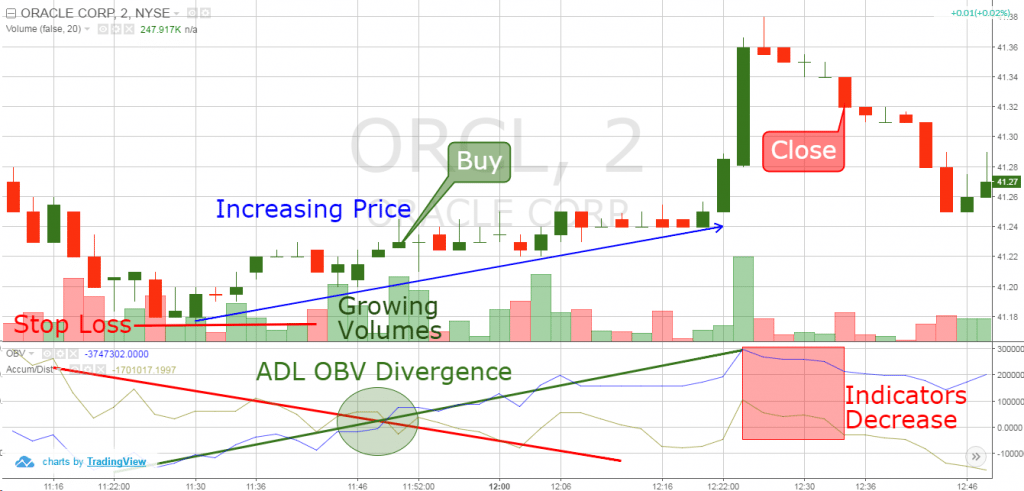
The OBV estimates the cumulative volume flows in relation to cost changings. It shows the volume of an asset’s accumulation or distribution by the movement of the valuation. The measuring looks like this: cost closes higher – the OBV is added; cost closes lower – the OBV is subtracted. This indicator reveals the details about the tendency’s current state.
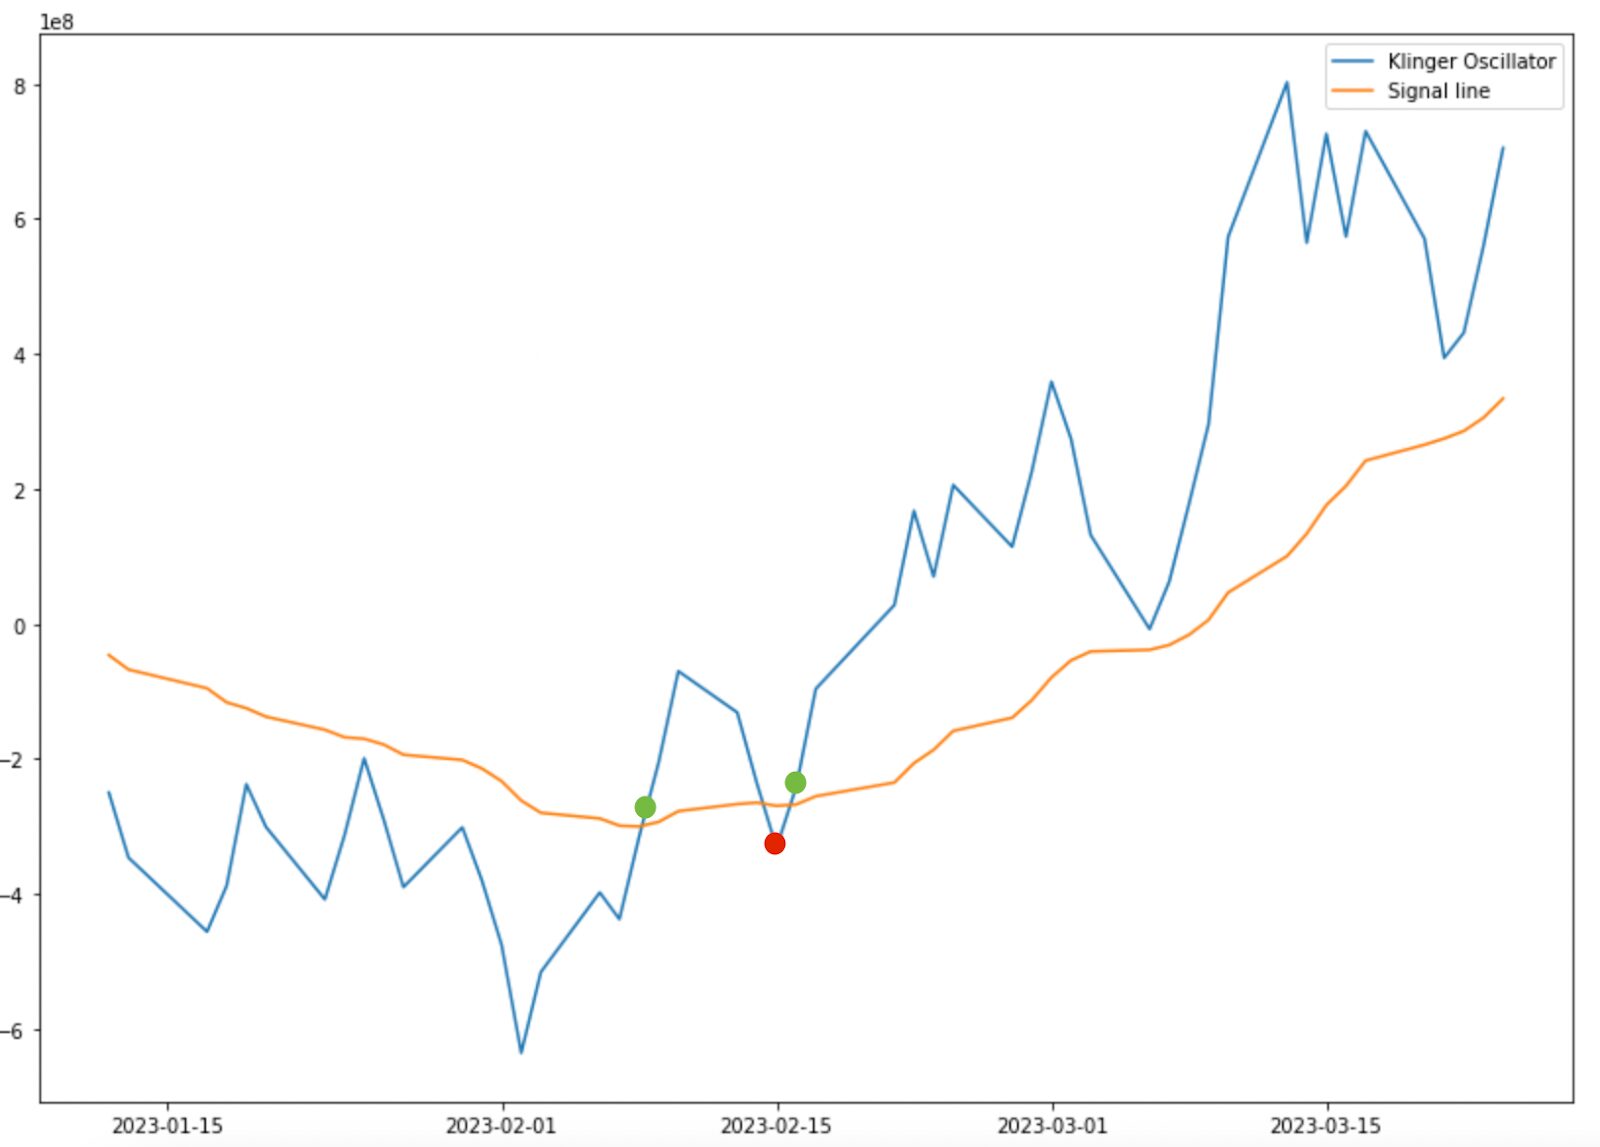
Klinger oscillator
This tool is also used to discover the current tendency’s state: potential reversal or confirmation. It uses the volume’s direction and force to calculate the market’s speed and tendency power. The Klinger Oscillator is calculated by subtracting the volume’s two exponential MAs (EMA)
Accumulation/distribution line (ADL)
The ADL is a technical tool which interprets the asset’s buying or selling amount by closing valuation and trading volume. The base principal: cost is higher than the expectations – the ADL is added; cost is lower than the expectation – the ADL is subtracted. After all, it is the indicator’s condition which helps to investigate the money flow within the observed security.
VO in trading
The VO creates a huge impact on a trader’s decisions. To maximize the capitalisation of this instrument you need to follow certain rules:
- Search for the divergence in the volume and valuation changes.
- Confirm the cost’s moving pattern with the VO’s moving pattern.
- Look for enormously high and low levels of the VO around the midline. It is usually 0. Low negative values – oversold. High positive – overbought.
- Don’t be afraid to use other indicators with the VO. You will be able to have a better perspective on the situation.
- Pay attention to big volume jumps. It can signal about future possible breakouts and the overall changes. If the VO rises with such jumps, it means the confirmation or the reversal.
- Follow the VO’s divergence throughout several timeframes. The unchangeable divergence can prove the future tendency’s reversal.
- Check the VO and trading time: VO should be aligned to the trading time. This gives you a more detailed look at the tendency.
- Risk management. It is important to every step in the trading field. Don’t forget about stop-loss orders and make a move based on your own risk tolerance.
These rules can help you to increase the efficiency of the VO. Its tendency analysis can provide very important information about the market’s future changes.
Strategies
Of course, there is more than one way to use the Volume Oscillator. Let’s discover them
Divergence trading
As we discussed from the start, the VO helps you to find the divergence between the indicator itself and the valuation’s movement. There are two divergences:
- Bullish divergence. The valuation reaches a lower Low than the VO.
- Bearish divergence. The cost reaches a higher High than the VO.

Market players often use this strategy. It is profitable enough and if traders use the VO in connection with other technical tools – very profitable.
Trend confirmation
Based on the VO, you can confirm the current tendency. People often operate with the Volume Oscillator to make sure that the valuation rises or drops. There are two cases, as always:
- In bullish trend. VO is increasing with the valuation.
- In bearish trend. VO is decreasing with the cost.
Based on that, traders can make moves and depend on a current tendency.
Breakout trending
This strategy is applied when the valuation of a security goes under a support level. You need to discover significant cost changes to capture that. The VO gives you a helping hand and observes the volume expansion when this situation occurs. It shows the jump in volume which confirms the breakout.

The VO provides the necessary dependable information about breakout to make the future trading move.
Volume spike trending
This strategy is based on gaining from the huge jumps in trading volume. The VO works like a spotter and indicates a spike by mind blowing high values. It is pretty much a time window for possible trades with a huge potential outcome.
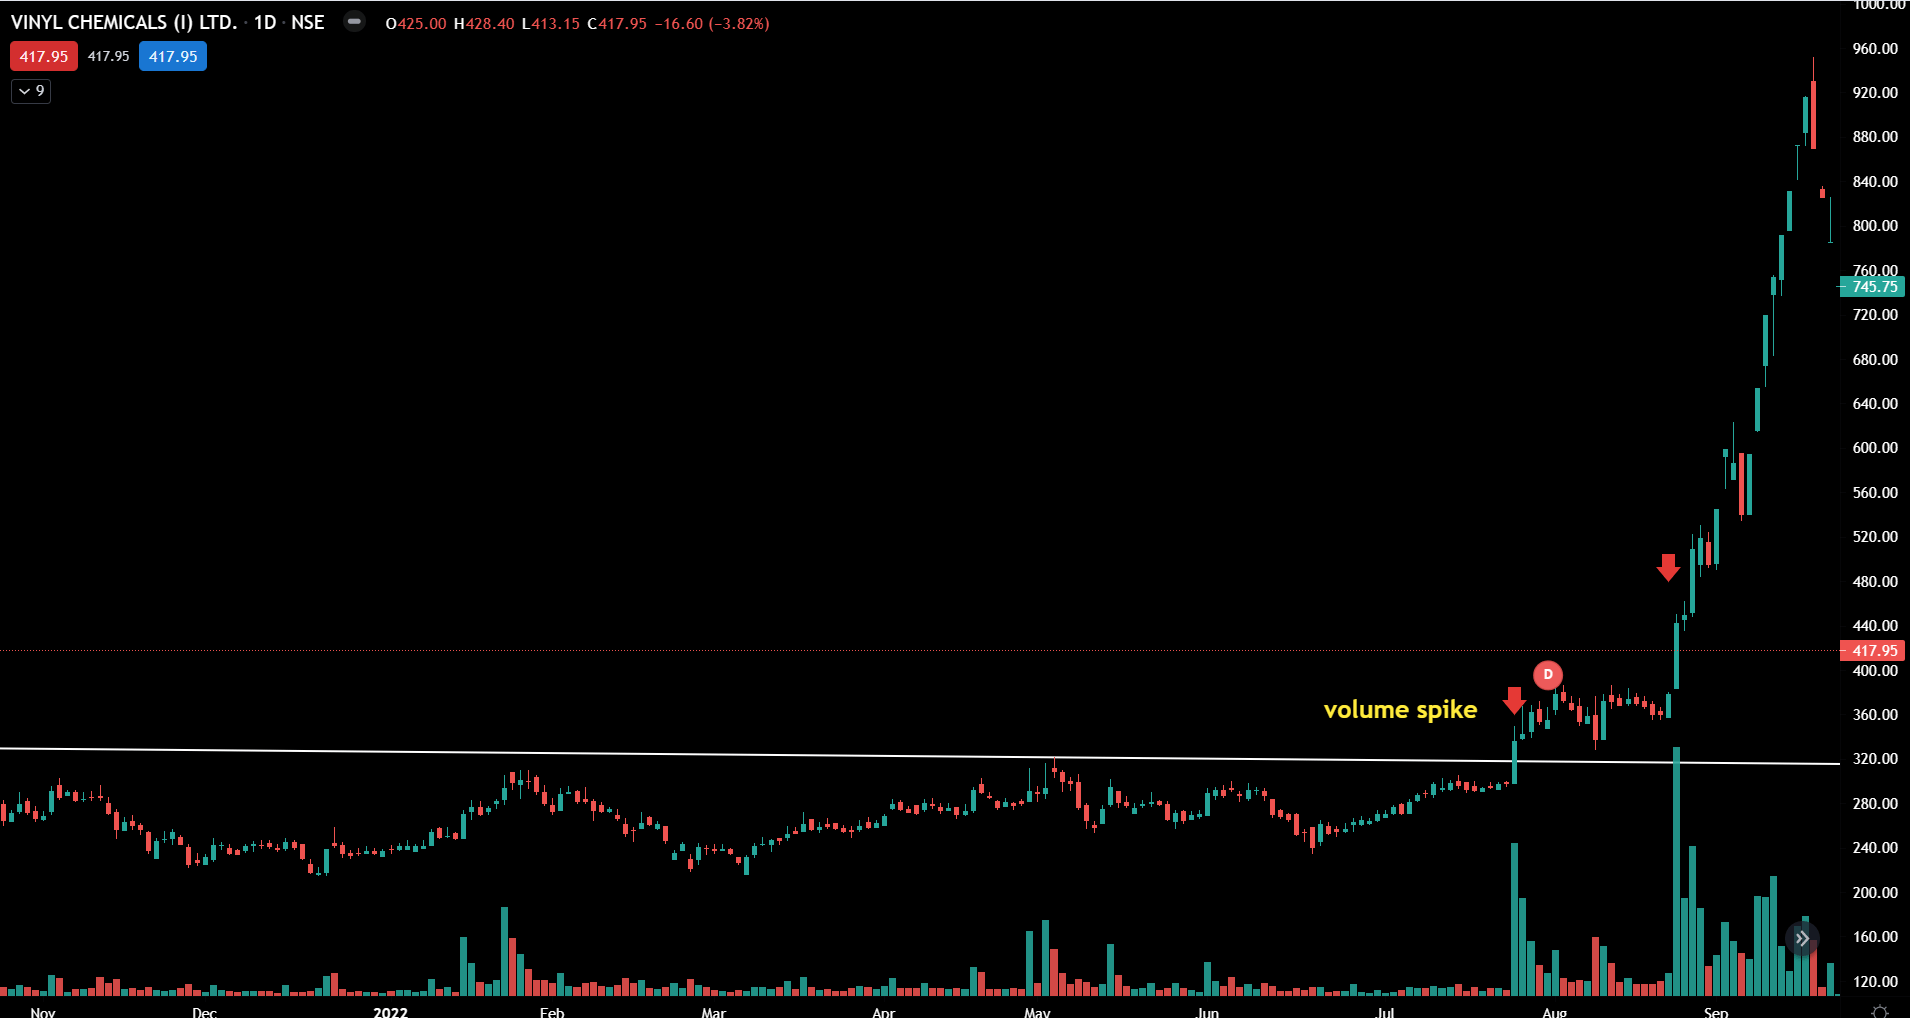
If the VO is used in connection with other technical tools, it increases the opportunity to gain from such a spike. But you need to remember about the risk, because it is quite clear that the situation is blurry without the necessary information. Connect spikes to the market’s situation overall, have a better perspective and make a move.
Advantages
The VO is a very useful tool. It has several beneficial sides:
- Volume confirmation. The tendency is validated, if the volume rises during an uptrend or a downtrend.
- Divergence discovering. Potential trend reversal or the confirmation.
- Reversal signals. Depending on the divergences between the VO and the valuation.
- Overbought and oversold. Both of these states can be discovered by the VO’s values.
- Breakout’s confirmation. Increased volume of the VO is the validator in this case.
- Wide technical base. It is a huge leap in the technical side of the story for the trader. You gain an impressive amount of knowledge about the market’s dynamics, especially if you operate with other indicators together.
- Volume spike’s detection. These events are rapid and it is a great advantage to have the ability to discover such events.
- Flexibility. You can adjust the VO as you wish. It has a wide range of settings which can be applied in the compatible way to your own trading market’s moves.
- Risk management. Market players identify the current market activity level and calculate the volatility. It helps significantly in the future loss reduction.
Drawbacks
Despite all of its benefits, the VO has some disadvantages:
- Dependence of the volume information. Some platforms have a direct influence on the VO’s accuracy. It blurs and distorts the result.
- Lagging indicator. No real-time basis. It can miss several short-term signals.
- Whipsaw signals. These are errors within an unpredictable or low volume. It can negatively affect the trader’s decision.
- Does not show the direct valuation information. It reviews only the volume information. The valuation’s data is not shown. Of course, it does not give you the full perspective of the market’s condition.
- It is not as useful as in connection with other technical tools. Based on the fact that the VO does not give you a full understanding of the market’s situation, you need other technical tools to combine with.
- Subjective interpretation. This is the exact definition of a human factor.
- Unfortunately, not every market condition is suitable for the VO. In the condition of high changeability, the VO’s standings could be not as dependable as it is with the more stable market.
- This tool does not work the exact same way in all time windows. Lower time frames give noisy signals which means the short-term volume change. Longer time frames do the same thing, but are not compatible with day traders and scalpers.
- It is too difficult to use at the start of the trading career. Despite the bright side of a big amount of knowledge you gain, it would be difficult to process all the weight of the information at the beginning of a trading career.
- Media and market mood. The volume Oscillator does not include all the other factors which have an influence on the market: all the news events and sharp shifts.

Usual mistakes
Every trader is not perfect. Here is the list of all the basic mistakes:
- Huge dependance on the VO. Some traders just don’t use other technical tools which later on leads to a profit loss.
- Lack of observation for valuation changes. You need to compare both of the values to have a good enough point of view.
- Not paying attention to the divergence continuity. It could lead to unexpected trend reversal. Of course, it would be expected, if the trader paid enough attention.
- Not using the other sources to confirm the given information. The VO needs to be cooperated with a whole market situation, news and outside variables.
- Not paying attention to main volume jumps. It can lead to missing main changes in the market’s direction.
- Bad choice in timeframes. It could lead to false trade signals. This is a straight way to a profit loss.
- Not thinking about the real reliability of the required volume information. The lack of checking will lead to misleading and a potential loss.
- Following the wrong, whipsaw signal. Wrong signals will be followed by poor trading decisions, if it is not recognised.
- Bad risk management. You need to use stop-loss orders and position sizing. This will improve your stability.
- Not paying attention to the current market’s mood. Ignoring the whole market will lead to another misguidance. You need to include a bigger picture in your observation to get the desirable result.
