

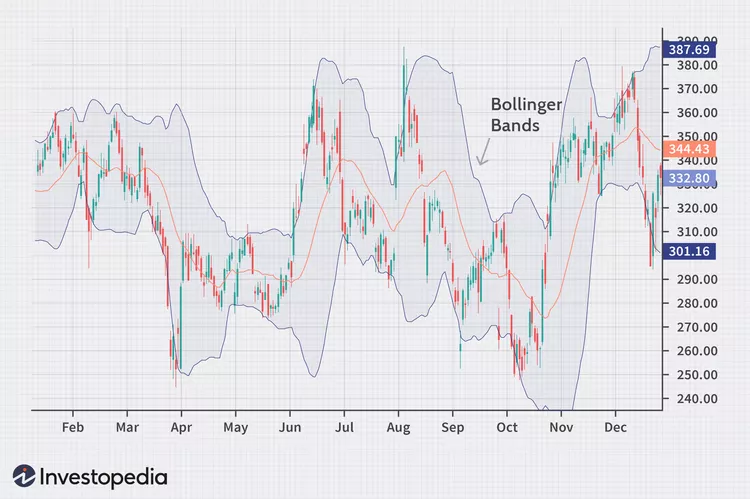
Bollinger Bands is a technical tool used in the crypto industry to analyze price volatility and potential trends. It can be used to identify:
- breakouts or trend reversals (if the price breaks through the upper or lower band, it may indicate a shift in market momentum or a new trend forming);
- overbought (price is near the upper band) or oversold conditions (price is near the lower band).
The bands can be created by adding and subtracting a multiple of the standard deviation of price movements from the moving average line. Along with bands, there is also a moving average on the Bollinger Bands that shows price moving average index (usually 20-days long).
Traders use this information to make trading decisions, such as selling when the price is overbought or buying when the price is oversold.
Top news


Comments
Subscribe
Login
0 Comments
Oldest