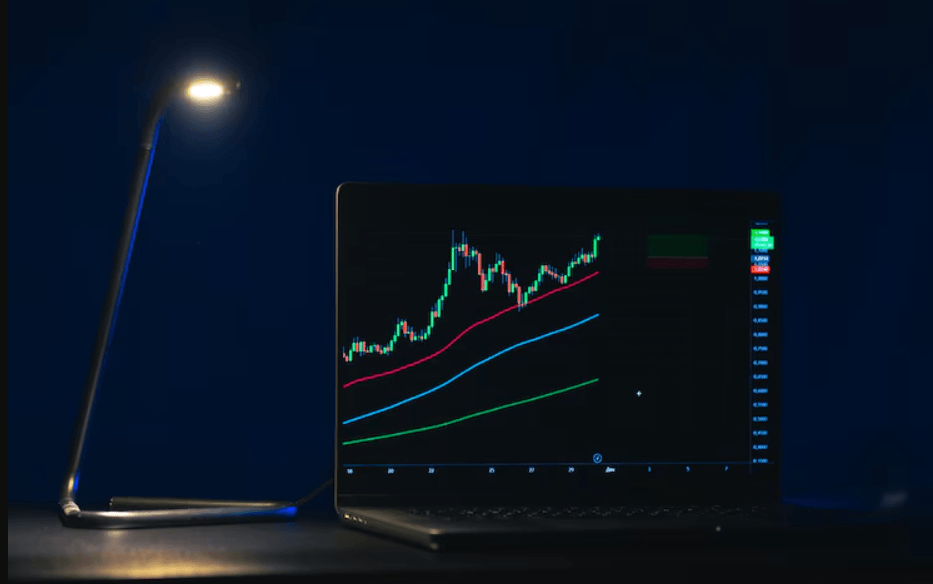


There are several ways to, possibly, predict the future behaviour of the asset’s price and one of them is a chart. However, there are different patterns which generate a variety of decisions to make. Let’s take a look at continuation patterns and analyze the readings that fit the definition of such sequences.
- Definition
- Types
- Flag Pattern
- Pennant Pattern
- Triangles
- Rectangle
- Reversal Pattern
- Head and Shoulders
- Double Top and Double Bottom
- Triple Top and Triple Bottom
- Continuation vs Reversal
- Utilization
- Identifying
- Confirming
- Volume Analysis
- Practical advises to avoid false indications
- Instance of the Continuation Pattern
- Summary
- FAQ
- What continuation pattern is?
- What types do we have?
- How to avoid False Signals?
Definition
While using the chart, traders can identify a continuation pattern which shows the stable asset’s price movement within specific boundaries. Such sequence of action also can be described as neutral because of the uncertainty that exists around the price movement direction. During this period of time, the asset doesn’t follow either an uptrend, nor downtrend. The utilization of the chart can provide the trader with an additional amount of time and data to investigate before making a next move.

Moreover, this type of pattern can signal the continuation even after the future momentum of the asset’s price can possibly move in the same stable direction.
However, it is crucial to acknowledge the features of it, because there is one more type of pattern that exists – the reversal which prior function is to define potential points of the valuation reversals in the future
A continuation pattern is a recognizable chart pattern denoting temporary consolidation during a period before carrying on in the original trend’s direction. Traders can use such a pattern to decide when to enter or exit a position and generate returns in the short term.
Such a pattern offers some logic to an asset’s price action. Traders can prepare a trading plan and reap the benefits offered by the common patterns. Technical analysts utilize different types of continuation patterns as a sign that the asset’s price trend will remain the same. A few of them are pennants, rectangles, flags, and triangles.
Types
There are different types of the continuation patterns which can indicate different explanations to the price behaviour. While analyzing them, an investor can adjust his strategy to the existing situation on the market and improve the risk management. Here are the most common types of these price movement sequences:
- Flags.
- Pennants.
- Triangles (Ascending and Descending).
- Rectangles.
Each of them also has a sub-definition, depending on the price behaviour: bullish or bearish. It is important to acknowledge this due to the direct connection between the valuation changes and the next trading move which depends on it. Let’s review these types.
Flag Pattern
It can be detected at the time of an asset’s continuous movement after a rapid increase or decrease. This behaviour can be described as controversial due to the fact that the cost moves in the opposite direction of the initial tendency.
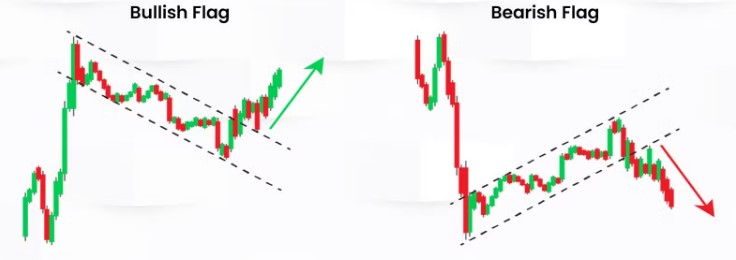
The visualisation of this type of pattern contains a rectangular form which has similarities with a flag on a pole. The ending of the sequence occurs at the time of the breakout: the asset returns to the initial trend.
Pennant Pattern
It may resemble the principles of the flag pattern, however, it contains a triangle which is symmetrical. The key difference is the length of such periods of time: it usually continues for a brief amount of time (several days or weeks).
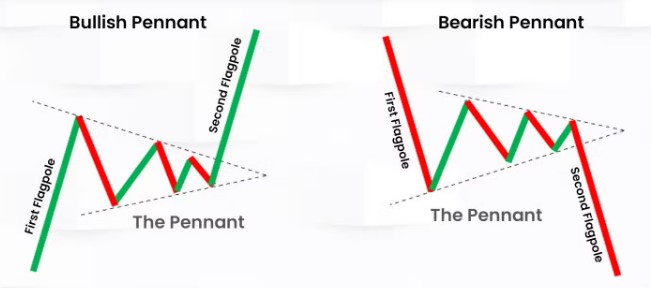
When the rapid valuation movement occurs, the valuation has a synergy with converging tendency lines.
Triangles
There are two types of the triangles which may occur on the chart:
- Ascending. If this triangle appears – the market continues to increase the buying pressure which, later on, can lead to the potential breakout of the resistance. It is visualized as an unchangeable level of the resistance, which is flat, and an increasing support level.
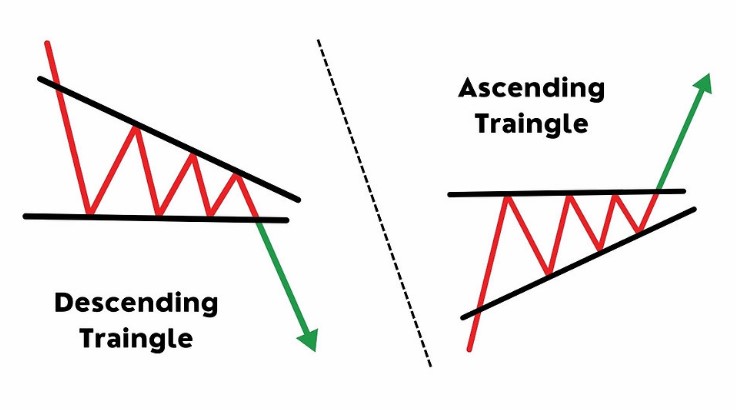
- Descending. Conversely, it stands for the opposite: the constant increase of the selling pressure that may continue up to the support level’s breakout and further. This pattern consists of a flat support level and a decreasing resistance level.
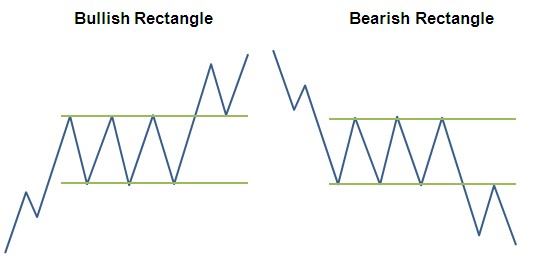
Rectangle
Rectangle may be known as the most obvious type because it can be identified quite simply: when the asset’s valuation is contained within both support and resistance levels which are both completely parallel.
Reversal Pattern
It is crucial to learn how to find a difference between the reversal and continuation pattern. The sequence of the price action can fit the reversal chart pattern if it indicates the potential opposite movement possibility. There are several existing types:
- Head and Shoulders.
- Double Top and Double Bottom.
- Triple Top and Triple Bottom.
Let’s analyze each of them individually.
Head and Shoulders
It is a quite popular chart pattern which may predetermine the potential reversal of the valuation movement trend: from bearish to bullish and vice versa. Its name is explained by the readings which resemble head and shoulders: two peaks which are both lower than the central peak that is contained within both of the lower ones.
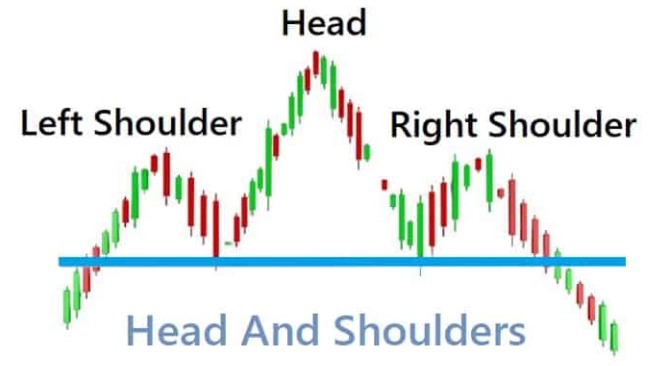
The confirmation of this sequence is defined as a breakout of the support level which is visualized as the line between the shoulders.
Double Top and Double Bottom
Double top shows the domination of buying pressure. It looks like two high points which are both at the same level. This level can also be described as the resistance line. The expected price movement in the future is the reversal towards the selling.
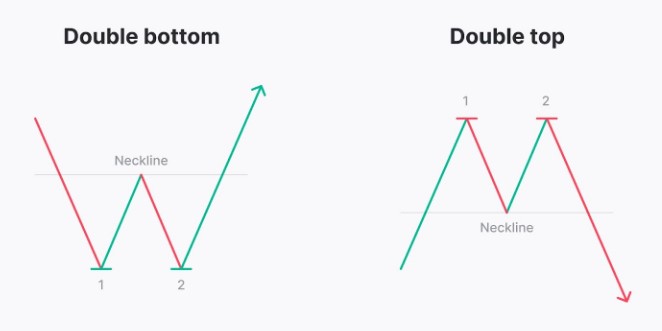
Double bottom is the opposite: there are also two points, but at the lower level which are defining the resistance line on the chart. It can help to predict the potential reverse to buying tendency from the initial selling dominance.
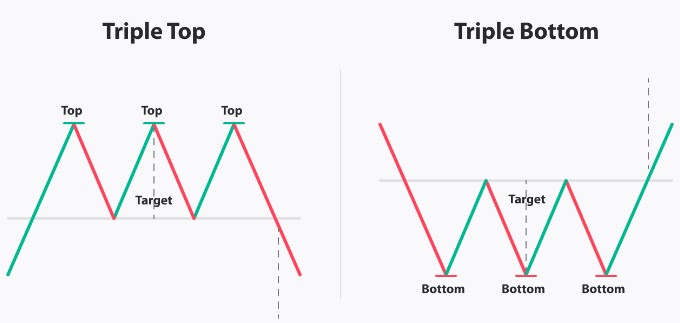
Triple Top and Triple Bottom
Both of them follow the principle of double top and double bottom. However, the difference between the double and triple is the power of the support or the resistance level. The same reversals happen after confirming that the pattern is correct.
Continuation vs Reversal
There are multiple fundamental differences between the continuation and the reversal patterns:
- The signals that they provide: one indicates the continuation of the initial tendency and the other suggests the price movement will be reversed.
- Patterns individual appearance.
- Timings of their formation.
- Market’s behaviour due to the cost behaviour.
- Main reasons for the formation.
- Entry points differ quite a lot, because different situations require a different approach.
It’s crucial to learn the individual features of them to adjust the strategy according to the chart and the potential price behaviour in the future which can be predicted by the utilization of the data.
Utilization
Before starting to react on the market changes, investors must know 3 main principles of the chart utilizing:
- Identifying.
- Confirming.
- Analyzing the volume.
Let’s review this sequence of action in a more detailed way.
Identifying
First of all, market players must find several signs of the possible pattern and define whether it is a continuation or a reversal one. It is highly-advised to use several time frames to identify certain patterns.
Confirming
The second step is confirmation. The identified sequence must be confirmed: it is crucial to wait for it to reveal itself in a more obvious way and make no rash decisions. Patience is the key to avoiding unnecessary risk.
Volume Analysis
After defining the sequence, it is important to measure the strength which can be done by utilizing the volume data. Potential breakout can be determined by the increase of the buying or selling pressure which reflects the market’s commitment.

Only after executing all of the steps, an investor can adjust the strategy and start the trading action.
Practical advises to avoid false indications
It wouldn’t be out of place to utilize multiple tools to confirm the signals. There are the common variants to choose:
- Relative Strength Indicator (RSI).
- Moving Average (MA).
- Moving Average Convergence Divergence (MACD).
The most efficient way to use chart patterns is to operate within a trending market because the features of them fit to the conditions. In addition, confirm the sequence by reviewing the previous data which contain similar asset’s movement patterns.
Instance of the Continuation Pattern
Let’s review the possible instance: the investor operates in Forex and detects a Flag pattern on the chart which subtype is bullish.
There is an EUR/USD pair which shows the 1.400 readings together with the pole that originates at the level of 1.250. The price moves within the borders between 1.325 and 1.400.
After identifying and confirming, an investor analyzes the volume data which is considered to be high enough to approve the uptrend’s future extension. Then, he can fix stop-loss at the level of 1.325 and set the target: 1.480. The next step is to enter the long-term position at 1.410.
Summary
Both continuation and reversal patterns are very useful to the traders which understand the signals that such chart readings indicate. However, a different sequence stands for a different strategy. Those who desire to profit while using such indications must consider the additional technical tools to confirm the change in tendency, continuation or consolidation.
FAQ
What continuation pattern is?
It is a sequence of readings that shows the stable asset’s price movement within specific boundaries.
What types do we have?
There are several types of continuation patterns: Flags, Pennants, Triangles (Ascending and Descending), Rectangles.

How to avoid False Signals?
The most efficient way to use chart patterns is to operate within a trending market because the features of them fit to the conditions. Moreover, the additional technical indicators like RSI, MA and MACD can greatly reduce the chance of getting the false signal and making a mistake.
Top news


Comments
Subscribe
Login
0 Comments
Oldest