


A Golden Cross is an efficient trading strategy which can increase the amount of the investor’s capital. But what is that efficiency about? Let’s dive deep into the Golden Cross principles of work and discover the necessary amount of information to utilize it in the most efficient way.
- Definition
- Levels of Accuracy
- Moving Average (MA) pair
- Exponential or Simple MA
- Top strategies
- Basic Golden Cross
- The pullback
- The breakout
- With Volume Confirmation
- With RSI & RSI Divergence
- Towards the bull market
- Summary
- FAQ
- What is the Golden Cross?
- What are the preferable Pair of MAs?
- What are top existing strategies?
Definition
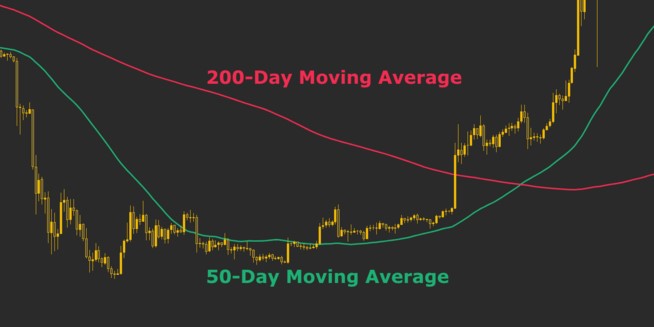
A Golden Cross is a trading strategy which involves two moving averages (MA) which cross one another. To be more specific, a short interval MA rises higher than the long or so-called long-interval line. The basic example of such an event: a 50-day MA which crosses the 200-day MA.
This kind of strategy relates to the bullish market indications which is explained by the connection between an existing cost tendency and the observed increase within the MA readings.
However, its indications may come with lags which makes it a lagging indicator because a golden cross fundamentally depends on historical price changes.
On the other hand, it may indicate a possible reversal of the existing trend by demonstrating this crossover.
Levels of Accuracy
First of all, it is crucial to know the levels of sensitivity of each moving average. The one that crosses the other is shorter which increases the influence of the latest asset’s cost. Surely, it shows the raise in the bullish segment. But the other way around is to connect the increment of short MA to the general buying volumes expansion.
The dependance on the historical data is one of the disadvantages which can be counteracted by additional technician instruments. That improvement reduces the overall inaccuracies that can be brought by the initial nature of the Golden Cross.
Moving Average (MA) pair
To start with, the initial knowledge of the two MAs being involved in a process is important, but let’s move on to the decision between the variety of moving averages to pick.

The most common and approved choice is 50-day MA as a short one, and 200-day as a long one, but it all depends on the period of time which is chosen by the investor. In case of a long term, 100-day and 200-day uncovers the long-term price behaviour. On the other hand, 20-day and 50-day MA stand for a short time window. The fundamental principle of choice is fully in a market player’s hand. Moreover, it is still quite important to involve the market sentiment in the overall evaluation of the price action due to the great impact it creates.
Exponential or Simple MA
Crucially, each of them can be used in the Golden Cross trading strategy, but which one to pick is the choice that lies in the features of the existing investor’s strategy. For a more precise approach to the latest cost movement, it is highly recommended to utilize the Exponential Moving Average (EMA) because of its abilities which provide the trader with a more weighted analysis of the recent data.

On the other hand, the more balanced approach will be to pick a Simple Moving Average (SMA) which reviews the data of the asset’s valuation equally. If a trader chooses an EMA – the crossover may occur before the SMA displays it.
However, the most efficient way to utilize the Golden Cross is to use a 50-day Exponential Moving Average, because of the ability to investigate the recent data deeply, and a 200-day Simple Moving Average for a longer period of time which involves a 4-time bigger segment that contains an important information about the history of the asset’s behaviour on the market.
Top strategies
There are multiple strategies that involves a Golden Cross, but let’s take a look at most popular ones around the trading field:
- Basic.
- The Pullback.
- The Breakout.
- With Volume Confirmation.
- With RSI & RSI Divergence.
Now, the individual review of each one.
Basic Golden Cross
This specific strategy is one of the most common ways to execute a long-term trade which is based on detecting the crossover point and finding the similarities between the crossover and the price movement. In other words: an investor identifying a potential crossover and decides to enter a long position. Additionally, he can also search for a retracement which can make his decision more or less confident, it depends on the outcome.
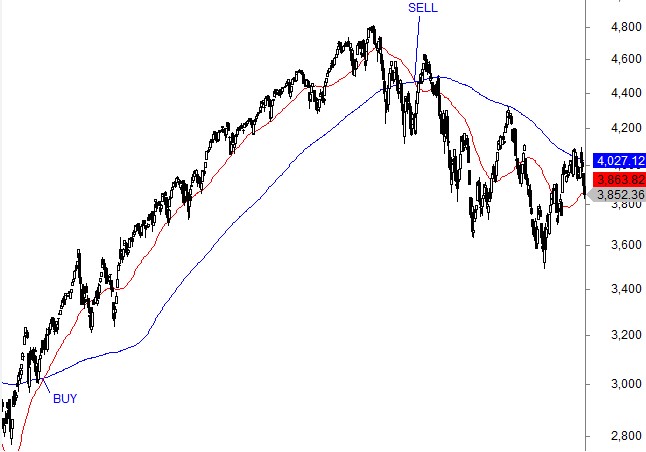
If it all fits, the entry point is confirmed and the long-term position is created. By doing a basic stop-loss order slightly below the crossover point, traders may significantly reduce the risk of losing too much to the possible unpredictability of the market.
The pullback
It is a different way to execute the trade by utilizing a Golden Cross pattern. Within this strategy, an investor waits for the pullback of the price after the short moving average goes across the long one. It is crucial to be patient and wait until the cost increase is confirmed by the later increase.
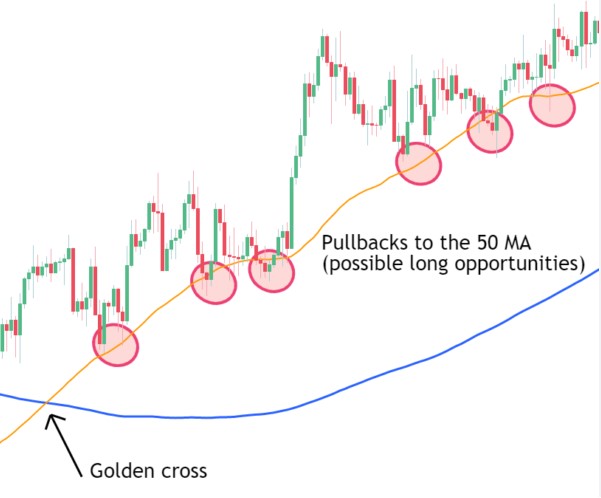
Observations of the certain support levels make this strategy happen, because the key principle of the Pullback is that the cost returns to these support borders. That works as a confirmation for a Pullback trader.
The breakout
Here’s another way to ensure that the future rising momentum will occur. This strategy suggests searching for a specific resistance level which can be discovered while observing the crossed moving averages.
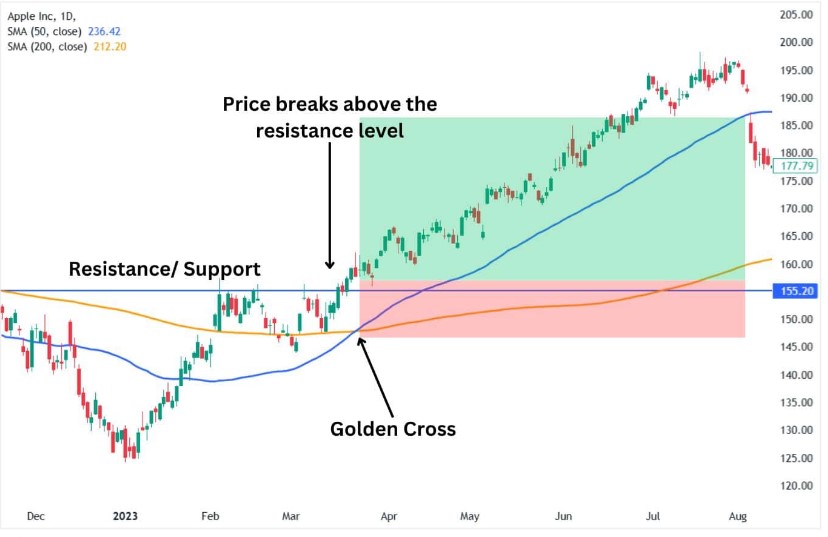
Right after that, an investor waits for the price to break through it and that is an indication to enter the trading position.
With Volume Confirmation
Despite being an indicator which approves the potential trade by confirming the future cost tendency, multiple traders still have their doubts and that’s where trading volumes play its role as the insurance. Here’s the common steps:
- Determining the crossing of the two moving averages.
- Analyzing the trading volume and comparing it to the data which is received from the crossover.

In addition, even if the trading volume is high enough and the asset’s potential seems to be quite high, it would be reasonable to put a stop-loss order to prevent the portfolio from falling apart: despite the prediction seems to be optimistic enough, there are many factors which can possibly reverse the valuation against all odds.
With RSI & RSI Divergence
One more way to ensure the crossover is strong enough to be profitable is to use the additional indicator, such as the Relative Strength Index (RSI) which is an oscillator.
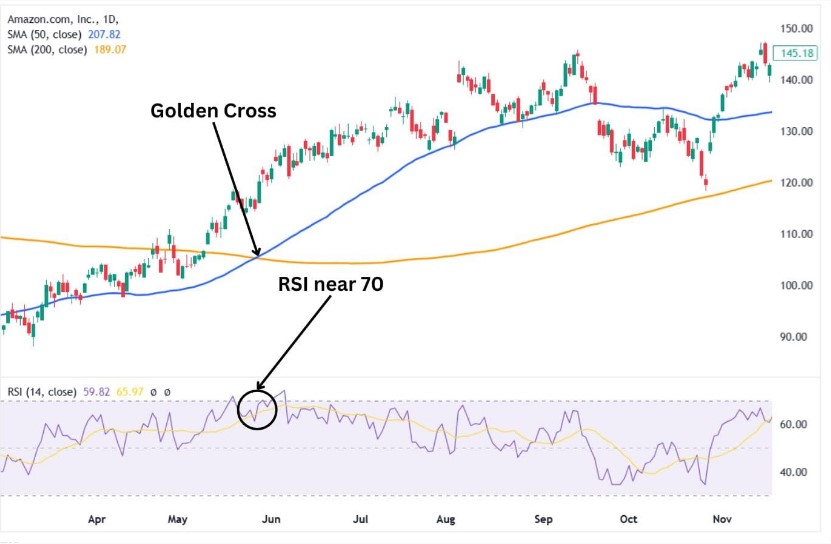
- Firstly, an investor can compare the RSI readings to the point of moving averages crossing one another: if the value of the RSI is below 30, it predetermines a potential increased bullish tendency which may occur in the shape of reversal.
- Secondly, the RSI divergence which can ensure the trader in a more significant way. The most desired readings of the Relative Strength Index should reach higher highs when the cost changes in a lower higher direction. Together with the strength confirmation, this method also checks the bullish tendency and helps to approve it by getting higher highs. Conversely, lower highs of the RSI readings together with higher highs of the price is a strong bearish confirmation.
Towards the bull market
Despite a strong dependance on the exponential moving average and the simple moving average, it is still a very reliable tool to define the start of the bullish tendencies. Nevertheless, it is considered to identify signals of the bullish sentiment after the bearish domination instead of the bullish market.

The best terms of the Golden Cross utilization are both short and medium time windows, because in the much longer perspective an investor receives significantly more blur readings which are not best to depend on.
Summary
A Golden Cross strategy has both advantages and disadvantages, but it is still a very popular and useful tool within the market. Small or huge gains can be received from the utilization of this pattern, however, it is better to use additional technical indicators to improve the quality of the data that the trader receives.
FAQ
What is the Golden Cross?
A Golden Cross is a trading strategy which involves two moving averages (MA) which cross one another.
What are the preferable Pair of MAs?
The most common and approved choice is 50-day MA as a short one, and 200-day as a long one, but it all depends on the period of time which is chosen by the investor.
What are top existing strategies?
There are five most popular Golden Cross strategies: Basic, the Pullback, the Breakout, With Volume Confirmation, With RSI & RSI Divergence.
Top news


Comments
Subscribe
Login
0 Comments
Oldest