


There are many ways to improve the trading strategy: analysing market sentiment, using a variety of leading and lagging indicators and e.t.c. However, let’s analyze one that can offer the trader a look at both past and future perspective of the asset’s price behaviour – the Ichimoku Cloud.
The actual definition
Firstly, It is a part of the technical research instruments which functions as an indicator. The signals that it provides are gathered around identifying the existing trend with its movement direction and both support and resistance lines of the observed asset.
Despite being a technical indicator, the Ichimoku Cloud utilization mostly helps to foresee the possible price changes in the future by predicting the power of the possible tendency and defining possible future support & resistance lines. Such abilities provide the investors with an intel which can prepare them for the possible trade in the future.
Principles of work
Being a technical tool, the Cloud offers the trader crucial information blocks which are considered to be the necessary knowledge before trying to predict the market:
- Determining the current trend, its strength and the type of it: bearish or bullish.
- Identifying both support and resistance borders of the asset’s price.
- Reducing the unnecessary data which helps to get a more clear perspective for the trend-following strategy.
- Making a prediction of the reversals which may occur later.
This technical indicator shows its full potential within the trending market, because of the focus on the tendencies. An investor can interpret the readings of this tool by the following ways: the asset’s cost is higher than the cloud – it means that the uptrend is dominating, price drops lower than the cloud – the downtrend is more likely to be prevailing.

The neutral state of the price is a middle – by being within the cloud, the asset’s valuation is under the sideways drift which means the uncertainty of the current tendency’s direction. However, it is difficult to utilize the indicator during the times of such uncertainty periods.
Historical background
The story of this technical tool started way ago: a Japanese technical analyst and journalist, Goichi Hosoda created the Ichimoku Cloud in the 1930s. Later on, he continued to develop the indicator and finished his work after many years: the 1969 year is the official release date of the Ichimoku Cloud. Hosoda spent a lot of time perfecting his creation and finally decided to provide the market participants with the variety of the Ichimoku Cloud functions.

The innovative approach of the overall asset’s behaviour evaluation was widely accepted by many. People found the instrument quite flexible because of the abilities to analyse the existing asset’s past and to predetermine the possible changes in the future. It is a widely used technical tool nowadays: it’s quite usual to improve the existing trading strategies after getting the readings of the tool: it is possible to utilize it by traders with both positioning: short and long.
Functional elements
The tool has several parts:
- Conversion Line.
- Base Line.
- Leading Span A.
- Leading Span B.
- Lagging Span.
Now, it’s time to review them individually.
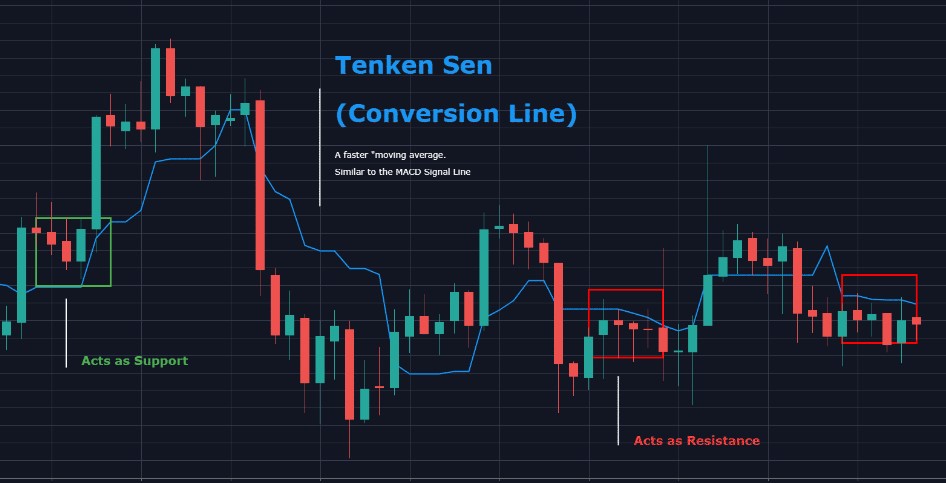
Conversion Line
Also known as Tenkan-sen, the Conversion Line functions within a short-term signal field: it reveals the possible indications of momentum changes which can be quite useful within the trending market trading strategies. Moreover, it is able to reveal support/resistance lines in a dynamic state.
There’s the formula for the calculation:
Conversion Line equals the sum of highest High and lowest Low which is multiplied by 9 previous periods and divided by 2.
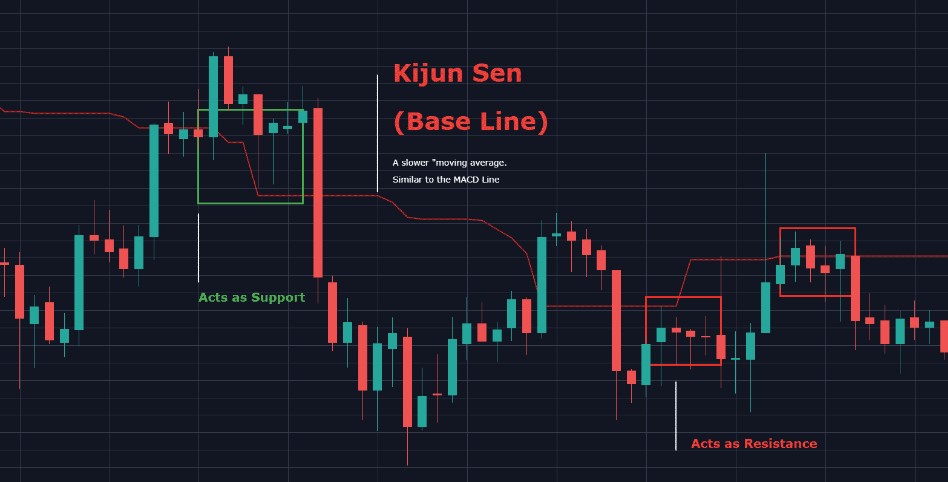
Base Line
The other name of the Base Line is Kijun-sen which is considered to be a middle-length trend technical identifier. The prior function of this line is to reveal both market balance and support/resistance borders that currently have the main priority.
It works in both ways: the crossover of the Tenkan-sen and the Kijun-sen’s higher level is a bullish one which indicates the buying timings and, conversely, when the Tenkan-sen goes across the Base Line’s lower lever – it is a bearish tendency which means that selling of the asset is currently can be relevant.
It is measured by the following formula:
Base Line = (Highest High + Lowest Low)*26 previous periods/2
Leading Span A
It is also known as Senkou Span A. It is the middle point of the Tenkan-sen and Kijun-sen. The prior difference is the period: all the 26 periods within the readings are predicted to be in the future. It is a rare function of the technical tool which helps to determine possible support and resistance lines. In addition, Senkou Span A is a much more dynamic limiter than the other part of the cloud structure: Leading Span B.
Leading Span A is measured by the formula below:
Senkou Span A * 26 periods = (Tenkan-sen + Kijun-sen) / 2
Leading Span B
The other name of it is Senkou Span B. Its prior goal is to define more powerful support & resistance boundaries than the Senkou Span A by reacting in a slower way. It has a more precise approach because both previous and future periods are included within the measuring. The continuous growth of the Senkou Span B means that an uptrend is quite likely to exist. On the other hand, the strong fall of the Leading Span B indicates the decreasing tendency of the asset’s cost.
It is measured by the following formula:
Senkou Span B * 26 potential future periods = (Highest High + Lowest Low) * 52 previous periods / 2
Lagging Span
Also known as Chikou Span, it has several functions:
- Identifying and confirming the trend.
- Defining support and resistance lines.
- Detecting future reversals.
- Disperse the possible false indications.
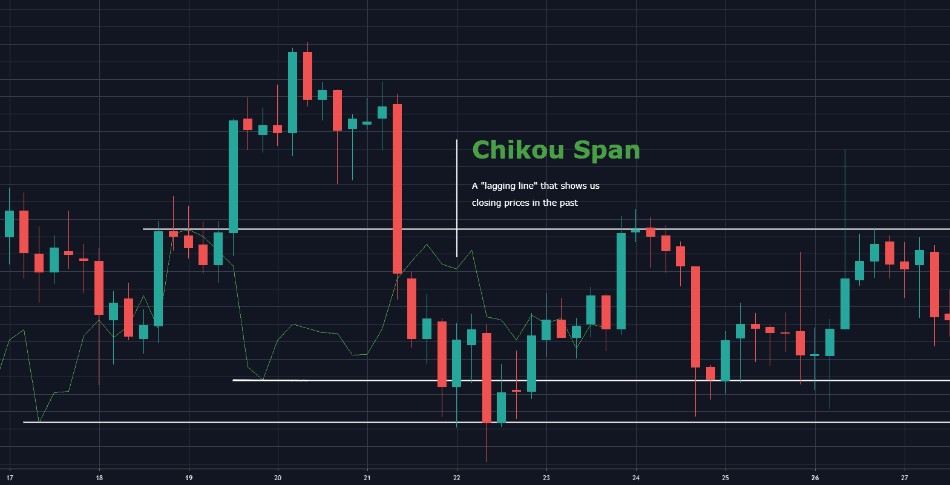
The readings of the Chikou Span show both uptrend and downtrend. It means that the price is increasing if the Lagging Span rises higher than the recent asset’s cost. On the other hand, if Chikou Span falls below the historical costs, it means that the current state of the momentum is a downtrend.
Here’s the way to calculate the Chikou Span:
Chikou Span * previous 26 periods = Closing Price (The Latest One)
Ways to utilize
The structure of the Ichimoku Cloud covers a huge quantity of the investor’s tasks. The utilization of it can uncover a variety of data: a brief rising tendency if the Tenkan-sen crosses the Kijun-sen’s higher level and a brief downside tendency if the crossed level is lower. Moreover, it can identify breakouts by certain readings. When the asset’s valuation goes across the boundaries of this technical indicator – it is most likely to be a breakout.

The other significant advantage of the Ichimoku Cloud utilization is being able to validate the tendency by the Chikou Span. In addition, investors can significantly improve their trading strategies with the analysing the state of Leading Span A and Leading Span B:
- Bullish trend: Senkou Span A is going higher than Senkou Span B.
- Bearish trend: Senkou Span A falls over the Senkou Span B.
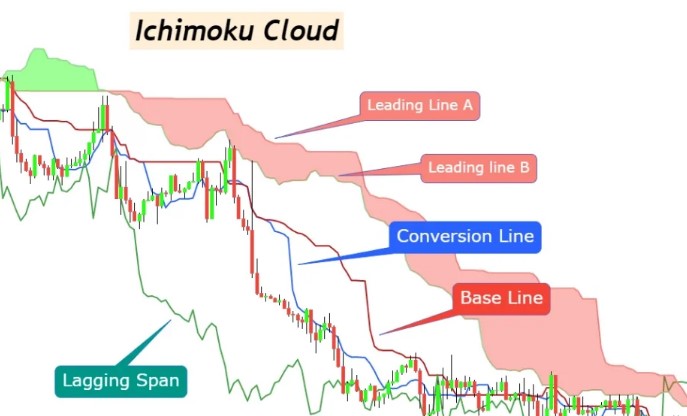
Here’s the visual representation of the chart which contains both Leading Span A and Leading Span B:
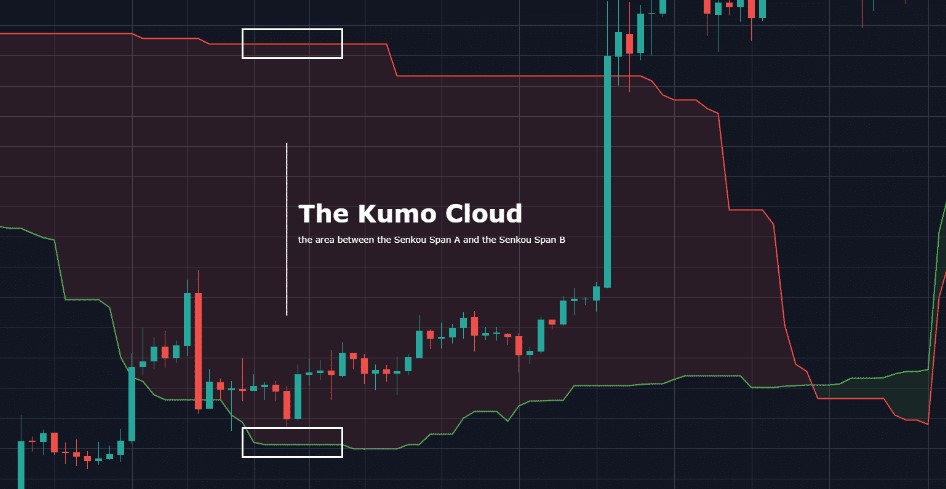
By examining all the elements of the Ichimoku Cloud, people can improve the existing strategy in a much more flexible way to improve the chances to get the timing for the profit.
Existing issues
Despite all the benefits, this technical indicator has several disadvantages:
- The difficulty: newcomers may find it significantly hard to use the Cloud.
- Certain lags because of the some level of dependance on the historical price data.
- Quite difficult to divide the data because of the multi-level structure.
- It is not very useful in a variety of markets due to its principles of work.
The Ichimoku Cloud is considered to be a complex tool to apprehend. That’s why it is crucial to learn all the structure of the instrument and several market factors to enable the Ichimoku Cloud’s potential.
Summary
The Ichimoku Cloud is a highly-efficient tool within the trending markets. It provides the trader with multiple abilities, such as defining the support and resistance levels together with trends in both current and future time. However, it requires a certain amount of knowledge to utilize the readings in the most efficient way. That’s why the new participants of the market can find it very difficult to use the Ichimoku Cloud and may misinterpret the readings.
FAQ
What is the Ichimoku Cloud?
It is a technical tool which creates the signals that help to identify the existing trend with its movement direction and both support and resistance lines of the observed asset.

How to use it?
- determining the current trend, its strength and the type of it: bearish or bullish;
- identifying both support and resistance borders of the asset’s price;
- reducing the unnecessary data which helps to get a more clear perspective for the trend-following strategy;
- making a prediction of the reversals which may occur later.
What about limitations?
- the difficulty: newcomers may find it significantly hard to use the Cloud;
- certain lags because of the some level of dependance on the historical price data;
- quite difficult to divide the data because of the multi-level structure;
By the way, it is not very useful in a variety of markets due to its principles of work.
Top news


Comments
Subscribe
Login
0 Comments
Oldest