


There are several tools in the investors hands which can be used to identify existing price tendencies and one of them is Moving Average Convergence Divergence indicator. Let’s review this technical instrument and define its both benefits and drawbacks.
MACD: Definition
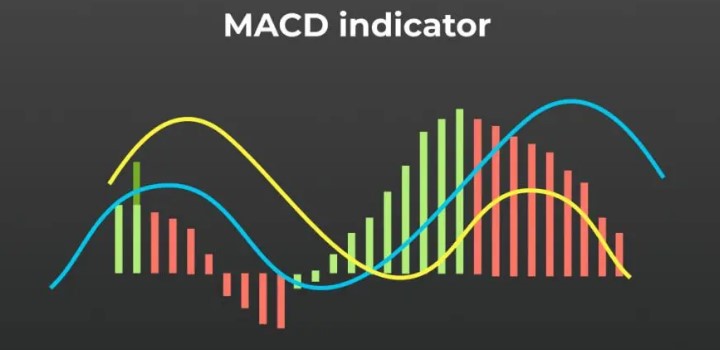
MACD is a Moving Average Convergence Divergence which is an instrument of technical analysis. The usage of this indicator provides traders with the ability to determine current price trends and calculate its momentum. Moreover, MACD affords the opportunity to define buying and selling signals. MACD contains the relationship between two exponential moving averages (EMA) which are connected to the cost.
It was created by Gerard Appel in the 1970s and has become a very desirable tool in the investor arsenal since then.
Indications
MACD signals that the asset should be bought or sold by several indications: if the MACD line goes higher than the signal line – an investor can choose to buy it. Conversely, if this line drops below it – it may be an indication for selling or short. There are several interpretations of the instrument readings. However, the most popular are: divergence, crossover and quick rises or falls.
How to calculate
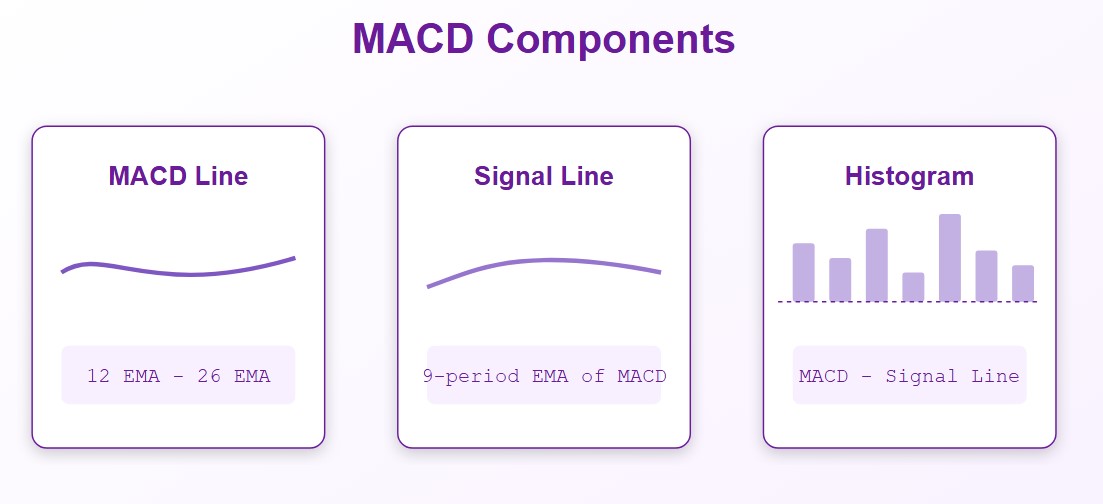
To measure the MACD line, traders need to use the following formula:
12-day EMA – 26-day EMA.
EMA is an exponential moving average that differs by paying much more attention to the latest price date of the asset.
Utilizing
There are certain readings which must be acknowledged before utilizing the MACD. First of all, the positive value: the 12-day EMA rises above the 26-day EMA. Conversely, the negative value occurs if the 12-day EMA falls beneath the 26-day EMA.

The widespread way to display this indicator is a histogram. It is widely used by many investors to detect maximum points of the bullish or bearish tendency. Moreover, the utilization of such histograms can help with detecting the overbought and oversold asset conditions.
Comparison with Relative Strength Indicator
There is another technical tool which is used to identify the security’s both overbought and oversold conditions – the Relative Strength Indicator (RSI). It is an oscillator which prior ability is to determine the average cost gains and losses. It works within predetermined time periods: the most common value of such periods is 14. Default boundaries of the values are 0 and 100. There are two most usual readings of the RSI: numbers higher than 70 means an overbought condition and the value lower than 30 stands for an oversold asset condition.
The key difference between them is the confidence in these conditions. The RSI, like a variety of oscillators, determines overbought and oversold levels by analysing latest price movements. Usually, such oscillators are used together with an MACD indicator which improves the initial data that investors can get from using only one of these tools. It is crucial to utilize them in conjunction because of the relativity which is the fundamental base of the MACD lines.
Despite both being the overbought and oversold condition detectors, the RSI and MACD can have controversial reading. For instance, if the RSI determines the latest price movements as an overbought (because of the readings higher than 70).
However, the Moving Average Convergence Divergence indicator can show the continuation of the buying tendency at the same time. It is explained by the differences between the initial factors which are included in the value measuring. Same story can occur with oversold conditions, conversely.
Drawbacks
As any technical tool, MACD has its limitations. False positive divergences that occur despite the fact that it can predict possible reversal, there is no insurance that the prediction will guarantee success. There are several occasions of such false divergences which happen during the cost sideways movement in a consolidation. MACD can miss the real signals due to the decreased momentum of the existing trend or that kind of sideways move.

There are several ways to confirm the signal such as the DIrectional Movement Index (DMI) which contains the Average Directional Index (ADX). It has specific readings of the current trend state: if the value of the tool is higher than 25 it means that the tendency is in place. The opposite story happens if the readings are lower than 20 – no tendency in place.
When it comes to both MACD crossovers and divergences, investors usually utilize the ADX to confirm the indications. It is safe to say that in case of MACD shows a bearish divergence – it must be checked with the ADX to ensure the trend condition.
Crossovers
There are several indications which exist within the MACD: bearish signals stand for the selling opportunity (MACD is lower than the signal line), and bullish signals mean that it’s time to buy the asset due to the possible growth of its price (MACD is higher than the signal line).
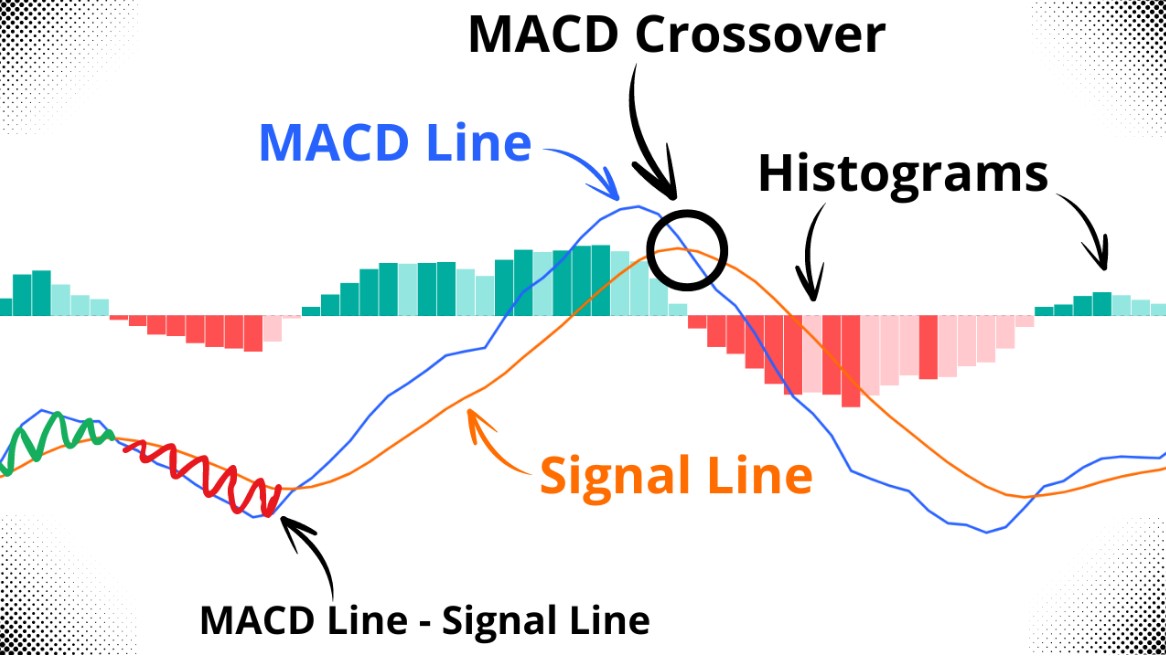
When it comes to the crossovers, it’s much more useful to detect and prove the current trend momentum and its direction. For example, if the readings drop a little bit and then rise above the signal line – the tendency of the price increasing is more likely to continue for a good amount of time. The opposite story occurs when the readings slightly increase and then drop below – the price is more likely to decrease for a continuous amount of time.
Divergence
There are multiple situations where the instrument readings at the extreme points (both high and low) increase or decrease beyond these levels which is also known as the divergence. It looks like this: two increasing lows pretty much correspond with two decreasing lows on the cost. It usually confirms the bullish indication at the time of the long-term tendency remains positive.
Conversely, two decreasing highs correspond with two decreasing highs on the valuation means the creation of the bearish divergence which occurs during the continuation of the existing bearish tendency.
Instance of the quick decrease and increase
It’s not a rare event when the readings of the Moving Average Convergence Divergence indicator drastically increase or decrease. In other words, it stands for the asset’s oversold or overbought condition visual presentation. It also means the next statement: the asset is likely to return to normal condition in the nearest future. Such readings are usually confirmed by additional technical analysis’s instruments (the RSI, for example).

Moreover, it is popular to utilize both MACD and its histogram equally. If readings of the MACD itself strongly suggest that it is a divergence, crossover, quick increase or decrease it also means that the same information can be received within a histogram of the instrument. However, it is crucial to have sufficient knowledge to improve the necessary skills: it is not a rare occasion when the signal timing of both MACD and its histogram are not matched with each other.
MACD in trading
There are different ways to use this technical instrument, especially in trading. Investors usually try to predict and determine any possible changes of the asset’s price movement and its direction. The key principle of being based on statistical tenets can be difficult to the newcomers. However, the knowledge it requires will be rewarded with the ability to determine possible timings of buying, additional buying or selling which can be a significant advantage within experienced hands.
Type of indicator
There is no discussion about the type of this instrument – it is a lagging indicator because its fundamental base consists of the existing historical data of the cost changes. There is another way to use the MACD histogram which is described as the attempt to predict any potential changes in the current tendency.

On these occasions, this tool can be recognized as a leading indicator that can be utilized for the possible trend variants.
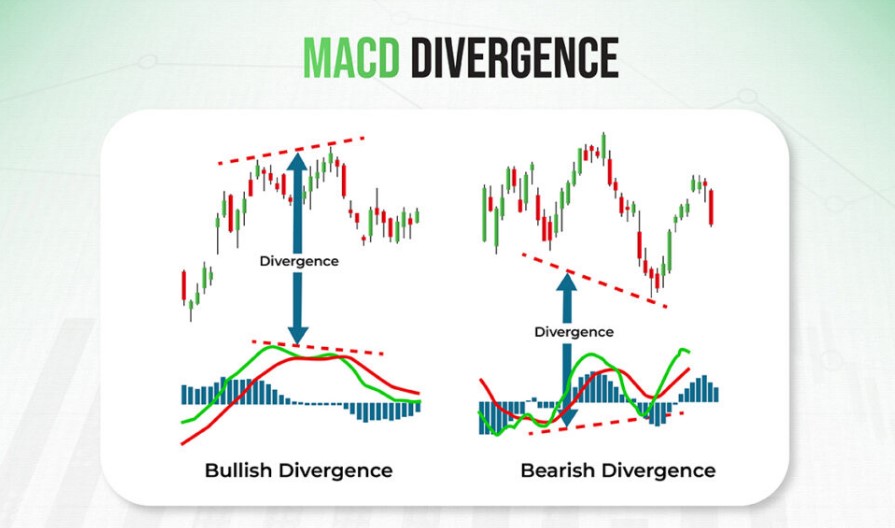
Defining the MACD bearish & bullish divergences
There are two possible divergences which can happen:
- Bearish. The negative divergence which means the difference between the price and the MACD readings. In that specific case, the asset’s price rises higher up to the new extreme point while the readings of the indicator aren’t able to do the same.
- Bullish. The positive divergence – quite the opposite story which contains the following differences: the indicator isn’t reaching the new bottom extreme point which is reached by the asset’s price.
It is important to utilize several indicators to choose the next step when both of these divergences occur due to uncertainty which can appear at the time of such events.
The worthiness of the indicator
This tool can be controversial in several cases and it’s crucial to learn its principles of work before implementing MACD to the trading strategy. Despite having several limitations, it is still a highly efficient tool in conjunction with additional technical instruments.

The investor’s own trading preferences and his knowledge are the key factors which impact on the choice: to use this instrument or not.
Top news


Comments
Subscribe
Login
0 Comments
Oldest