


It is quite difficult to decide whether the asset deserves the attention or not. There are several efficient ways to analyse it – relative valuation model. Let’s have a review of it and define its upsides and downsides.
What does it mean – to use relative valuation model
The principle of comparing an observed company to its comparable rivals is a relative valuation model. The result of such a process is the measurement of the chosen company’s financial valuation.

It’s a common choice of many people to use the relative valuation model after calculating the intrinsic value by using the absolute value model which provides the observation, specifically, without comparing a company to any competitors. By performing several ratios and benchmarks the relative value presents the price of existing company’s shares.
Another way to use such a model is to define the real state of the company: is it overvalued or undervalued which creates a much deeper information field to operate with.
There are several ratios which are used within it:
- Price to Free Cash Flow.
- Price to Earnings.
- Enterprise Value.
- Operating Margin.
- Price to Sales.
How to measure a ratio of the relative value
There are specific methods for a calculation of each existing ratios within this model:
- Price-to-free = Market Capitalization / Free Cash Flow

By executing this measurement people create a clear perspective on the relations between a market per-share cost of the company to its amount of free cash flow per-share. It helps to determine if the company can create additional revenue. This feature is crucial when it comes to the stock’s price and should be used within the observations.
- Price-to-Earnings (P/E) = Market value per Share / Earnings per Share

This ratio stands for a comparison of the share’s price to the company’s earnings per share. There are three different P/E ratios: Current, which is based on existing earnings, Trailing, which includes a last year of earnings, Forward, which stands for predicted numbers in the future. It is also crucial to operate with the same period P/E ratio while making any observations on several companies at the same time.
This ratio provides the analyst with sufficient knowledge about the stock’s condition: overvalued or undervalued.
- Enterprise Value (EV) = Market Capitalization (MC) + Total Debt – Cash and Cash Equivalents
Another useful tool in the hands of an investor: it helps to define the cost which would be enough to take over the analyzed company. It is widely known that this ratio is more useful than the MC calculation because EV includes a company’s current debt. In the case of a company being bought, the investor must pay the existing debts – that’s why it is more efficient to use EV.
- Operating Margin = Operating Earnings / Revenue

The main principle of using this ratio is to understand the amount of income that the project receives from its core business. It is compared to profit from additional sources of income. By determining this ratio, investors can define if the business’s management is performed well enough. It is crucial to investigate the management to be confident in the independence of the analyzed company in case the additional profits from investment will fail, vice versa.
- Price-to-Sales ratio = MC / Annual Revenue

This is an efficient tool which stands for an objective evaluation of the stock’s cost. It is connected to the market’s perspective on the business’ sales. Moreover, such an instrument determines the undervaluation or overvaluation of the stock. The most considerable number of this ratio must be low to prove that the investment is worth being done.
Existing models of relative valuation
There are two types of models exist:
- Comparable company analysis. It stands for the comparative analysis of the businesses within the public market. This specific process stands for defining the correctness of the company’s evaluation by comparing it to others.
- Precedent transaction analysis. While doing that the investor determines previous sale’s prices of the similar businesses throughout the history which, later on, gives the efficient knowledge about willingness to buyout the business.
The choice of analysis strongly depends on circumstances and is quite optional. The first type is much better to use to define the real state of the stock’s price: undervalued or undervalued. On the other hand, the second type is efficient while comparing the business to existing similar companies which offers you the estimated value of the analyzed project.
Comparable company analysis
Mainly, the are several stock models:
- Dividend discount.
- Absolute value.
- Comparables.
- Relative valuation.
In case of relative value – it strongly differs to others by the ratios that exist within the model. It operates with a variety of ratios which provides an informative comparison of the business to the similar ones.

There is a certain sequence of actions you need to follow:
- Determining the existing assets of the business and defining its market valuations.
- Adapt the valuations of the chosen business to those you’re comparing with. This specific action stands for defying potential market rivals.
- Execute the comparison between the similar companies.
Precedent transaction analysis
On the other hand, there is another way to make an observation – precedent transaction analysis. There are several key steps within the action sequence:
- Look for similar purchases throughout history. The search must include several factors: company’s geography and both types of buyer and the company itself. This way you’ll get the measurement close enough to the actual value of the company you observe.
- Execute a comparison of the observed business to the discovered variants. The process consists of several steps: filtering the search list by removing the unfittable variants, ensuring that the earnings before interest, taxes, depreciation and amortization (EBITDA) are included within the chosen metrics.
- Based on the intel: measure the value of the company. For a fictional example, the analysis includes the Burger King: EBITDA of $200 million. After defining the business price it’s necessary to get back to the list of similar projects that was chosen. The next step after verification is to reduce the list to one single business which was bought for 6x times its EBITDA. The conclusion: target company’s value is $1.2 billion.
Criticism
One of the biggest drawbacks of the relative valuation is that the principle itself can burden the investor: all the action will be gathered around making the best of a bad situation, because it is limited to a one specific asset type. For instance, value funds improved and did significantly better than the S&P 500 at the time of the 2000-2002 year’s bear market. However, many of them lost money in the end.
Comparison with the intrinsic valuation
There are two existing ways to measure the business value:
- Relative valuation.
- Intrinsic valuation.
It is the Discounted Cash Flows (DCF) approach which is used for defining the intrinsic value of the project. In comparison with relative, the Discounted Cash Flows operates with a business’s potential free cash flow and discounts them which is based on a required annual rate.

Relative valuation is one of two important methods of placing a monetary value on a company; the other is intrinsic valuation. Investors might be familiar with the Discounted Cash Flows (DCF) method for determining the intrinsic value of a company. While relative valuation incorporates many multiples, a DCF model uses a company’s future free cash flow projections and discounts them. That is achieved by using a required annual rate. These measurements lead to an existing value of the business. It serves as a guidance for any future measurements of the possible gains from the investments. The principle: the price of the investment is lower than the DCF readings – it is a potentially profitable opportunity.
Instance
Let’s take a look at the example:
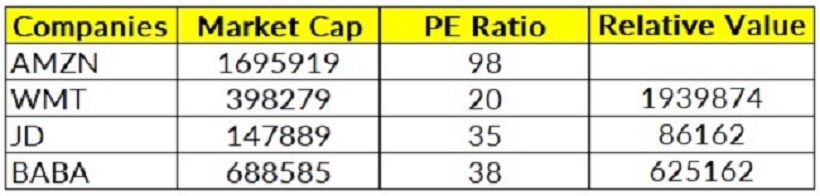
As it stands from the table: Amazon is overvalued relative to Walmart, Alibaba and JD.
Benefits
There are several upsides of this analysis model:
- Apples-to-Apples juxtaposition. The principle of relative value model provides analysts with an efficient intel comparison: asset’s price and a context within the market.
- Simplicity. All-in-All, this method is much simpler compared to intrinsic. Moreover, it usually consumes significantly less time which may be an advantage, especially when it is about limited financial intel or estimating the private business value.
- Market-Based insights. The analysis itself is based on the assets conditions within the market. It reviews different assets in the same environment which provides an investor with a necessary knowledge about profit opportunities.
- Verification of the intrinsic metrics. Investors can back up the existing intel of the intrinsic value model.
Drawbacks
It’s crucial to remember the downsides of the model:
- The Best of bad. Many people choose to avoid the additional search for different potential opportunities to make profit while using the relative value model because of certain method limitations. There is no hundred percent insurance that the whole list of profitable assets will be included in the analysis.
- Imperfect comparison. It is based on the analysis and comparison of the“peer group”: analogous assets. However, it’s quite difficult to find the identical properties of the assets in terms of risk and return conditions.
- Dependance on Market-Based Assumptions. The principle is simple: the market’s estimation is fully accurate. However, it is not the case on all occasions, because of the existing volatility, investor sentiment and influencing situations which can drastically impact on the asset’s price.
- Private companies provide a limited financial intel. It is quite difficult to execute the measurement with lack of data.
- It does not include the intrinsic value. The model is based on comparing a variety of assets within the market’s prices. It is crucial to remember that the relative value model doesn’t analyse both future cash flows and margins.

In addition, the relative value model is a very efficient tool in the hands of the investor which works significantly better with several instruments: especially in conjunction with an intrinsic value model.
Top news


Comments
Subscribe
Login
0 Comments
Oldest