


There are two well-known trends within the market: bearish and bullish. But, what happens if the price doesn’t follow both of these tendencies: sideways trend – that’s what occurs. Let’s analyze this market condition and make the conclusion about the possibilities of gaining profit during the sideways trend.
Definition
The market which can be described as neutral is a sideways market. It is also known as “sideways drift” because of the conditions it creates: the valuation of the asset stays within the borders of both the latest peak and low. As it stands for the tendency – it holds a neither bullish, nor bearish direction.

Explanation of the “sideways” term
The main reason behind the sideways trading naming is in the principles of its work: existing positions stay within the borders of this trend and maintain a neutral tendency. The price is not under any extreme buying or selling pressure which helps to continue this kind of movement for a decent amount of time.
Such tendencies may occur with a huge variety of markets and assets which includes the stock market and many other commodities.
If the price behaves in this way, it means that there is a moment of uncertainty among the trading participants. Both sides can’t decide whether it’s time to give more bullish or bearish pressure. The line on the price chart can be described as almost fully horizontal because of the conditions it stays within.

The most common consequence of trend is a strong and continuous tendency which can be either huge amounts of buying or instant selling of the asset.
These “drifts” may happen because of multiple reasons:
- Inability to choose the direction of the asset’s cost movement by the majority of market participants.
- Critically small quantity of news which can impact on the both bearish and bullish tendencies to start.
- Scheduled updates of the amount of supply and demand which occur during certain seasons.
- Decreased community motivation to participate in trades with the asset because of its individual certain features.
- Huge economic events that increase the volatility within the market.
It’s common to have some troubles in identifying possibilities to make a profit during such conditions. Investors often resort to the moving average utilization with the desire to discover any potential entry timings by observing the latest cost changes. Moreover, some economic adepts highly advise traders to make an observation on specific assets which are affected with the “drift”. The reason behind this is that such holdings may profit despite the neutrality of the market’s existing trend.

The length of this condition depends on multiple underlying economic reasons together with market sentiment which has a great impact because of the human factor’s significant importance. Despite having a variety of possible durations, the sideways “drift” usually doesn’t continue for extreme amounts of time, because sooner or later, the market still picks the direction of the price movement anyway. The most common duration of this tendency usually lasts from several days to multiple months.
The key knowledge that must be preserved by any investor who tries to gain profit during such events is the understanding of the market it takes part in. Different markets require different conditions for such tendencies.
That’s why it is crucial to acknowledge the environment the trader works in and the reasons which lead to this outcome.
Determining
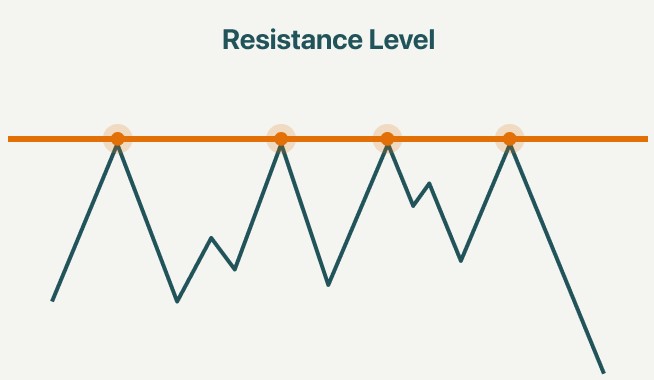
The most efficient method of the sideways trend determining is find both support and resistance lines which can be used as a base for possible trading decisions:
- Buying after the cost reaches the support line.
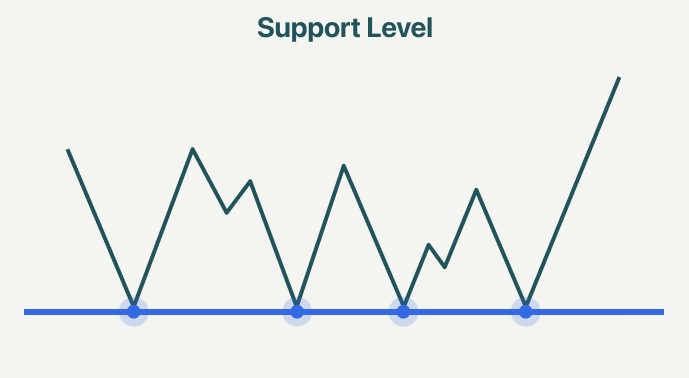
- Selling after the cost reaches the resistance line.
It is a common knowledge about the investing strategies and it can be applied to the sideways “drift”.
Adaptation and predictions
First of all, investors should determine the moment when the volatility starts to fall down by utilizing several indicators:
- Average True Range (ATR).
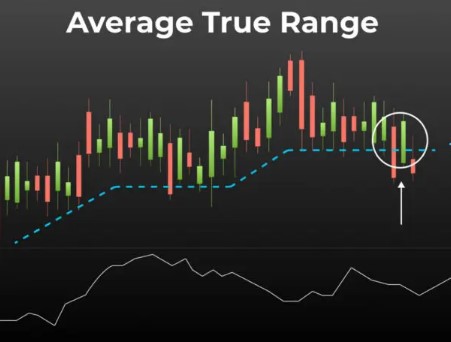
- Volatility Index (VIX).
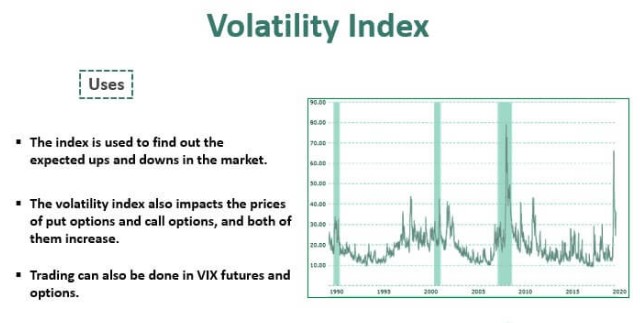
There are more to use, but these are the most common options for the task. After identifying the decrease, traders must determine the existing cost range by defining both support and resistance lines. In majority of cases, an obvious fall of the trend’s volatility and the readings of the oscillator being within the range may be the first indications of a potential sideways “drift” start. Despite this, it is quite hard to predetermine any exact future timings of the possible sideways trend or the changes within the financial market.
Profiting from sideways market
Despite being a neutral state of asset’s price behaviour, sideways market can provide an investor with a variety of possibilities to gain profit:
- Breakout / Breakdown. People identify both of these situations by utilizing multiple technical tools and e.t.c.
- Rebounding. If the trader successfully defines the boundaries of the price movement, he can start to buy the asset at the time of the approaching rebound from support levels. Conversely, the approaching rebound from the resistance level means that the investor may sell the existing holdings.
- Stock options. By using both straddles and strangles, people may confirm that the sideways trend continues on within the boundaries which were identified. Despite that, it is crucial to remember that such option’s prices can be drastically decreased due to the stock’s moving further down/higher than the support/resistance levels, respectively.
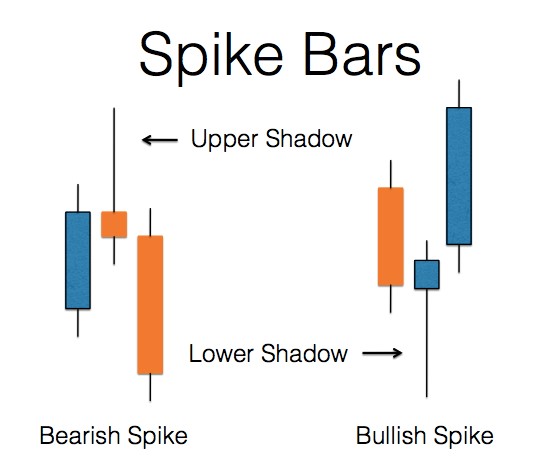
Spikes
One of the most important things to consider when the sideways “drift” occurs are spikes which can hit the price instantly for both short and long periods of time. It is quite difficult to react to such events because of the existing uncertainty within the neutral market.
These events lead many investors to trade carefully with no rash decisions because of the instability which follows such spikes, especially while the “drift” period is continuing. This is a widespread opinion that it’s better to treat the asset lightly: it is better to have a quick profit with no additional risks involved than the mistakes of holding the asset for too long, for example.
However, the majority of people have several troubles with determining the right timings of exiting the trades during these conservative periods. In other words, such ways to gain profit simply won’t fit for the trader who gains from the strong momentum of the price which direction is defined before and confirmed.
Summary
Sideways trend is a strange and difficult continuous asset’s condition which locks the price within the boundaries. It is not a usual situation and it may involve several complications during the forming of the trading strategy. People who desire to make profits from such events must be prepared for unexpected rapid changes, for making the best of the cost rebounding from both support and resistance levels. That’s why it’s crucial to get enough knowledge to execute such trading actions.
Top news


Comments
Subscribe
Login
0 Comments
Oldest