


Bitcoin is seeing a “logical and healthy” pullback, say commentators, with $25,000 now a key BTC price line in the sand.

On April 22, Bitcoin barely clung to $27,000 as a fresh wave of losses left the bullish camp with limited strength.
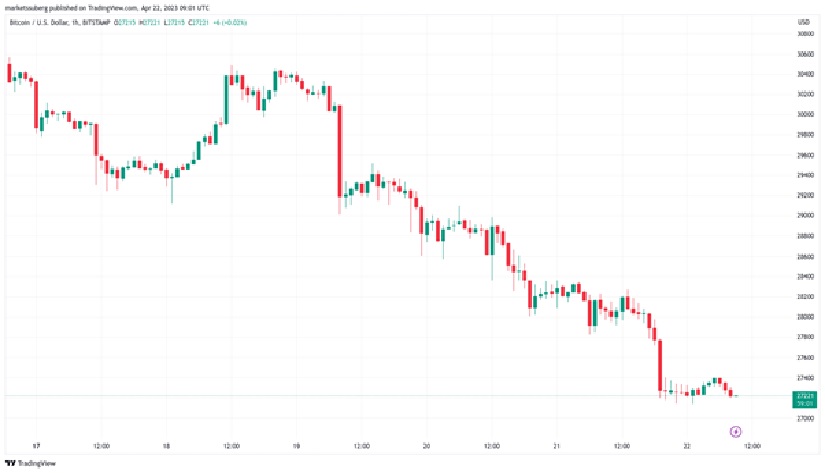
BTC/USD 1-hour candle chart (Bitstamp). Source: TradingView
Bitcoin bulls encounter massive RSI support reevaluation
Cointelegraph Markets Pro and TradingView data revealed that BTC/USD was just holding onto the $27,000 level on April 22, following a disappointing close to the Wall Street trading week.
Despite US equities achieving minor gains on April 22, Bitcoin continued to struggle, with analysts cautioning about a possible drop towards $25,000.
As a result, BTC/USD experienced a 10% weekly decline and a 4% decrease throughout April, based on data from the monitoring platform Coinglass. This marked a significant reversal of fortune compared to most of the first quarter.
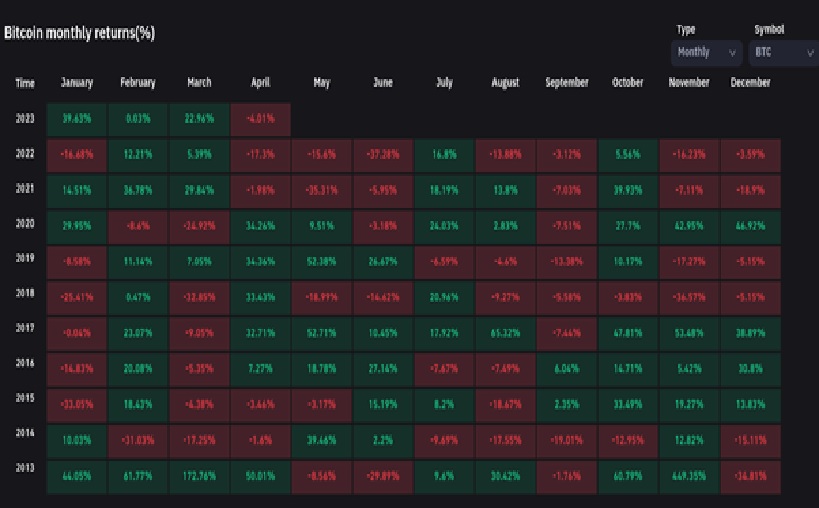
Bitcoin monthly returns chart (screenshot). Source: Coinglass
Nonetheless, well-known trader Credible Crypto maintained that there was still ample reason to believe the long-term uptrend for Bitcoin was unharmed.
He asserted in his recent Twitter commentary,
“If your macro thesis on Bitcoin has changed because of a $2,000 pullback after a $10,000+ vertical rally from 19k to 30k+, you’re doing it wrong.”
In a separate post, he contended that such price movements are “common” in the cryptocurrency markets.
“The last major retest we had was at 19k before our rally to 30k+. A retest of 25k here would be logical and healthy,” he declared.
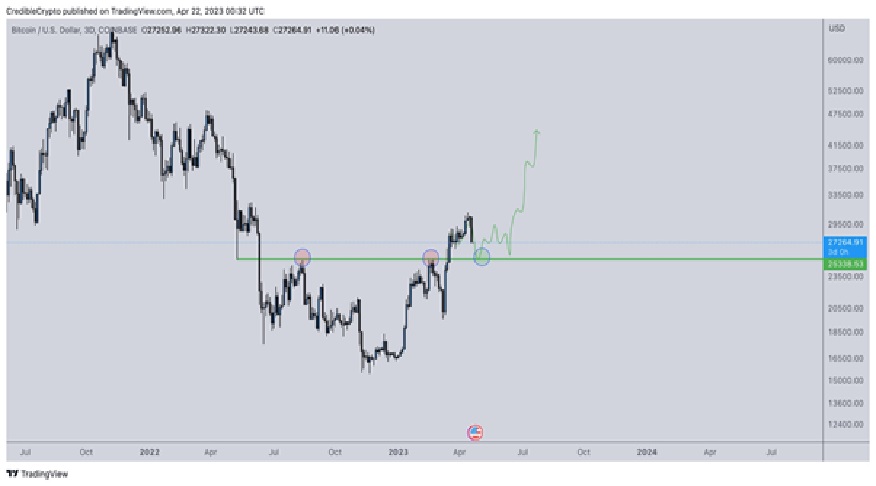
BTC/USD annotated chart. Source: Credible Crypto/Twitter
Financial information platform Stockmoney Lizards concurred, informing their Twitter followers that the path to higher prices might be gradual and consistent.
“After these huge green candles, we usually find some cooldown,” they noted, referring to the three-month BTC/USD chart.
“Short-/mid-term still bullish (3 months), but don’t expect it to go too fast.”
Crypto analyst CryptoCon arrived at similar findings, based on the recent shifts in Bitcoin’s relative strength index (RSI).
The RSI, which helps identify overbought and oversold situations at specific price levels, can provide valuable insights into upcoming price trends.
“Short term #Bitcoin price action seems grim, but behind the scenes, the Weekly RSI has broken out of a 6-year downtrend and is now attempting to make support,” CryptoCon disclosed, drawing parallels between the current activity and previous halving cycles.
“Bitcoin is now at decision point. Continue 2019 parabolic price action, or take the healthier, steady 2015 approach?”
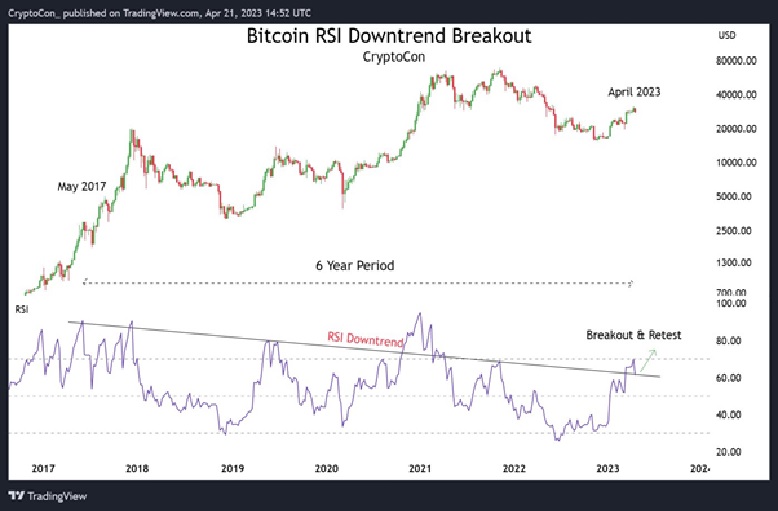
BTC/USD annotated chart with RSI. Source: CryptoCon/Twitter
BTC price analyst expects “stronger buy interest” near $25,000
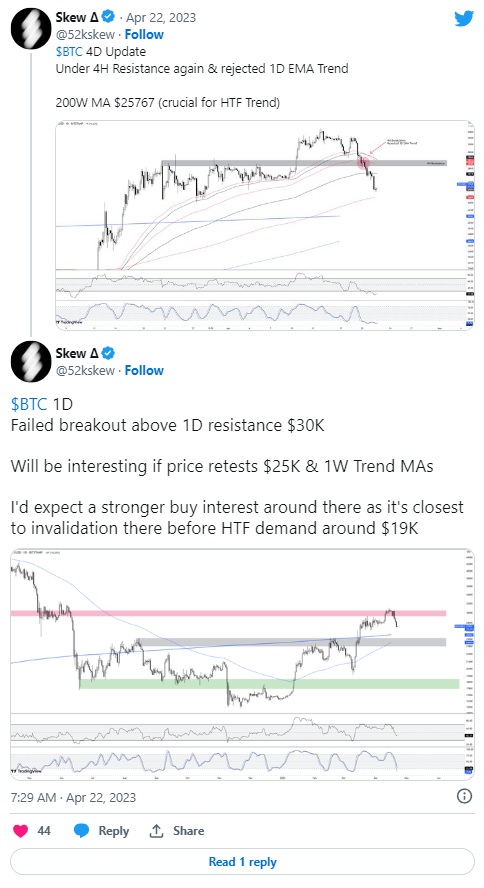
On the other hand, trader Skew explored possible short-term price objectives for BTC/USD, concentrating on moving averages (MAs).
The area above $25,000 continued to be the main focal point, with the 200-week MA situated at $25,850.
The market structure continued to be prone to liquidations, as Coinglass data revealed that on April 22, crypto long positions faced an additional loss of $173 million.
As reported by Cointelegraph, April 19 witnessed the highest number of long liquidations in 2023 up to that point.
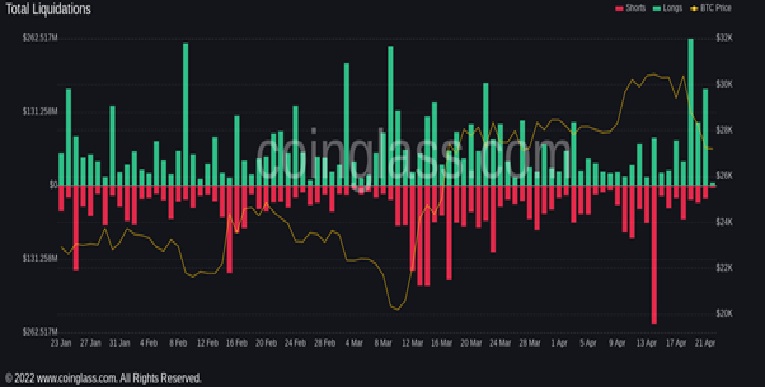
Crypto liquidations chart. Source: Coinglass
Source: https://cointelegraph.com/news/bitcoin-traders-call-for-calm-as-btc-price-slips-10-in-a-week
Top news


Comments
Subscribe
Login
0 Comments
Oldest