


BTC price action is shaping up to repeat a rare Bollinger Bands breakout, which only happens once per halving cycle, data suggests.

A prominent trader suggests that Bitcoin might experience unprecedented growth due to a straightforward trend line breakout.
During a Twitter conversation on May 5, the Crypto Titan highlighted an uncommon bullish signal on the Bollinger Bands indicator for Bitcoin’s monthly chart.
Bitcoin price may see “inexorable breakout”
BTC price movements are currently affecting sentiment in various ways across different timeframes. While there is uncertainty about short-term fluctuations, the consensus holds that Bitcoin’s primary growth potential lies ahead as the block subsidy halving approaches.
To anticipate what comes next, it might be sufficient to examine past halving cycles, particularly in terms of volatility.
As Crypto Titan points out, Bollinger Bands on monthly timeframes are preparing for a recurrence of a breakout event that has only happened once in each cycle.
In the two previous examples shown in an accompanying chart from 2016 and 2019, BTC/USD surged into the upper section of the Bollinger Band channel, resulting in significant gains.
Bollinger Bands are a crucial volatility indicator across various price timeframes. They revolve around a 20-period simple moving average (SMA) that serves as a midpoint, with two standard deviations above and below forming the channel.
These bands expand and contract with volatility and specific events: among them, the price touching the bands or even surpassing them is often deemed significant by traders.
At present, the one-month BTC/USD chart displays the price attempting to break above the SMA line, which, if confirmed, would suggest a classic repetition of previous bull runs.
Sharing his thoughts, Crypto Titan referred to the potential breakout as “inexorable.”
He added, “BTC is on the verge of breaking its monthly Bollinger Bands base line. And when that occurs, the first target will inevitably follow.”
“That would bring Bitcoin to a solid $63,500.”
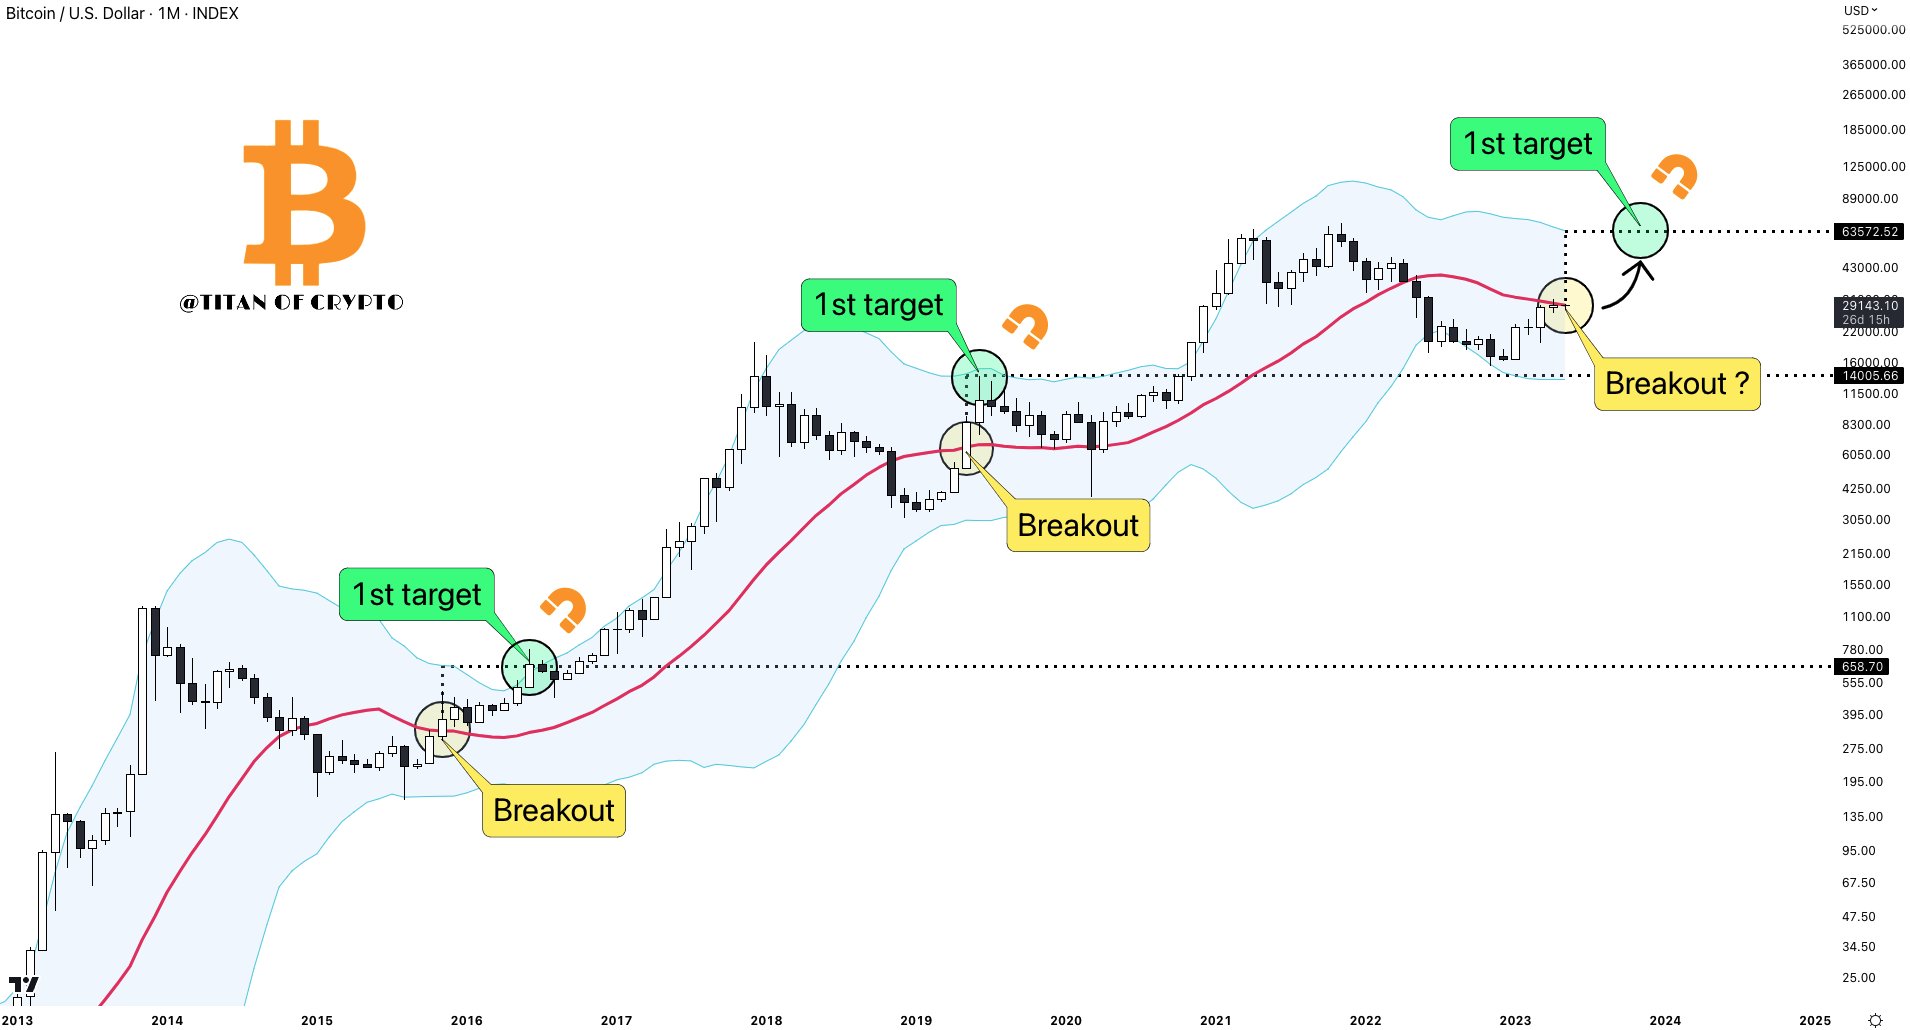
Although the price target may not be sufficient to reach its current all-time high, it could coincide with the halving event in a year’s time. The actual time needed for this to happen is still uncertain, as Crypto Titan acknowledges.
BTC price bides its time
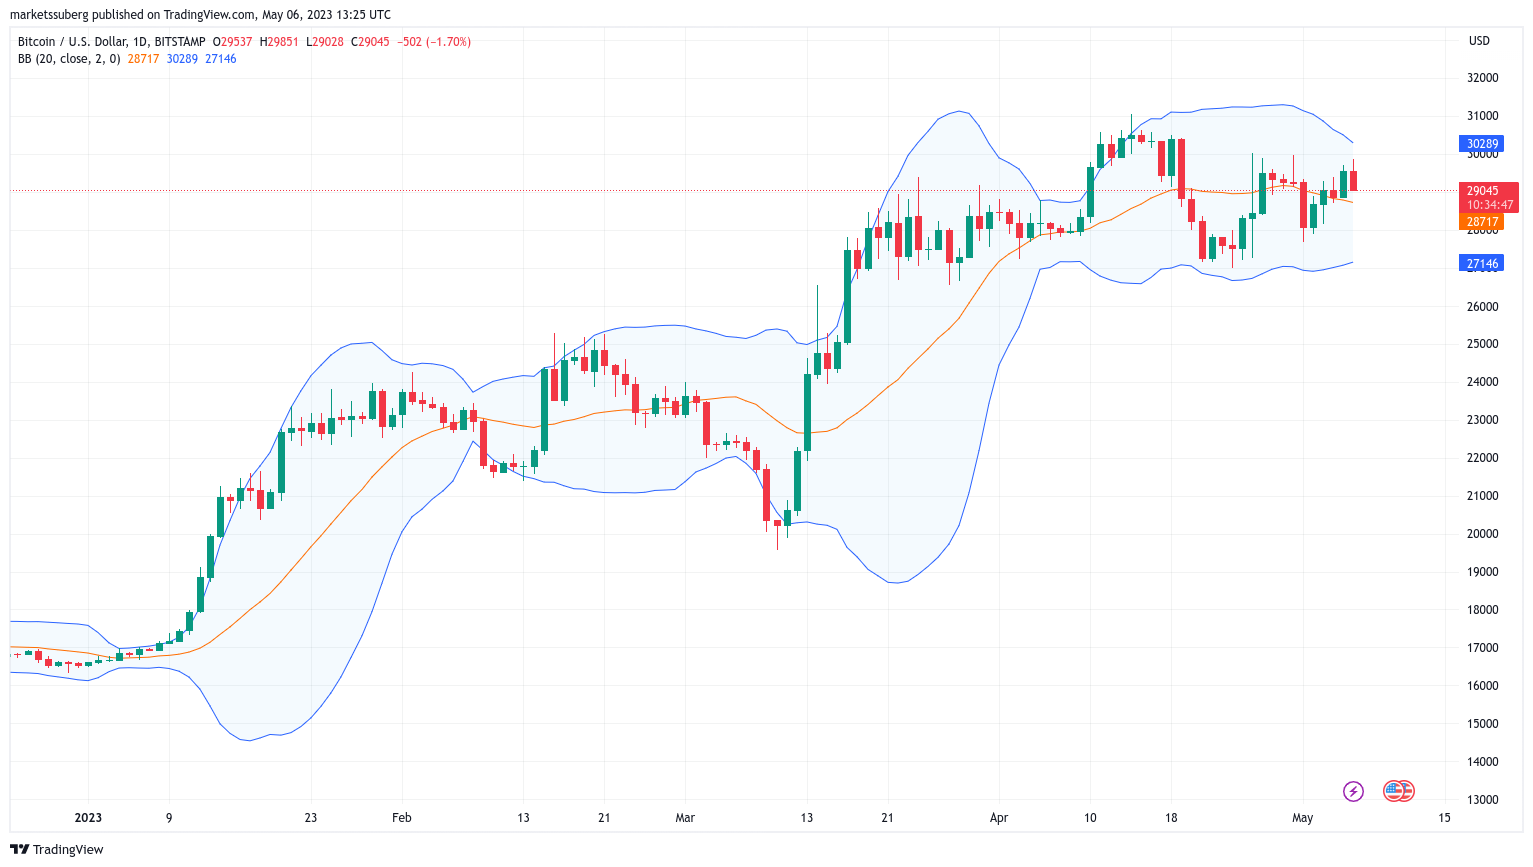
In the previous month, John Bollinger, the creator of the Bollinger Bands, contended that Bitcoin was at a critical juncture on daily timeframes.
Back then, the price was retesting the SMA line as support, breaking through to fluctuate around it. Currently, however, it is moving higher toward the upper band, as data from Cointelegraph Markets Pro and TradingView demonstrates.
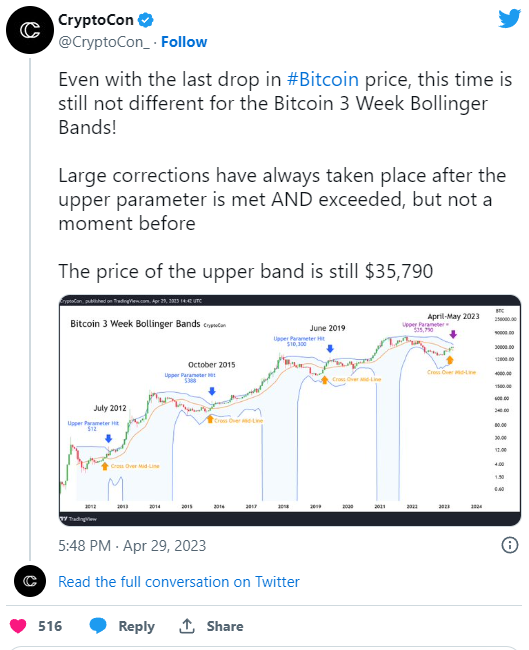
Following this, analyst CryptoCon proposed that the low-timeframe Bollinger Bands patterns stayed unaltered even though Bitcoin experienced a drop from local highs of $31,000.
Source: https://cointelegraph.com/news/bitcoin-trader-eyes-63k-btc-price-for-new-bollinger-bands-breakout
Top news


Comments
Subscribe
Login
0 Comments
Oldest