


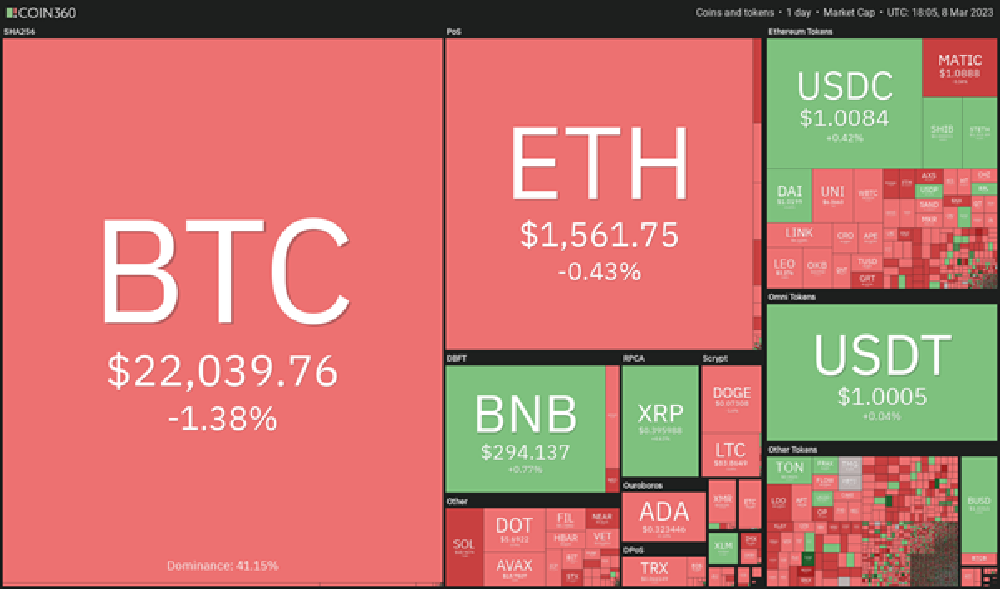
The U.S. dollar’s strength implies that high-risk investments may continue to face difficulties in the short-term. However, Bitcoin and some other cryptocurrencies are exhibiting signs of stability.

On March 7, United States Federal Reserve Chairman Jerome Powell warned that interest rates might remain higher for longer than previously anticipated. This boosted expectations of a 50 basis point rate hike at the Fed’s March meeting to about 70%, from 30% a week earlier, according to FedWatch Tool data.
The U.S. dollar experienced a significant increase, while the S&P 500 experienced a sharp decline following remarks made by Powell on March 7th. Nevertheless, cryptocurrency investors saw a small positive as Bitcoin remained relatively stable. The next market-moving event will be the release of the February Jobs report on March 10th.
Despite the unfavorable macroeconomic conditions for high-risk investments, Bitcoin has demonstrated a level of stability. This indicates that Bitcoin investors are not quickly selling their holdings in response to short-term uncertainty.
Is a recovery in the near future for Bitcoin and other leading cryptocurrencies? Let’s examine the charts of the top 10 cryptocurrencies to determine the answer.
BTC/USDT
The bullish investors are facing challenges in driving Bitcoin’s price back above the $22,800 level, indicating a lack of strong buying interest at current levels. This could result in a decrease to the crucial support level of $21,480, which is a crucial turning point in the short-term. The bearish crossover of the moving averages and the negative position of the relative strength index (RSI) suggest that the bears are in control.
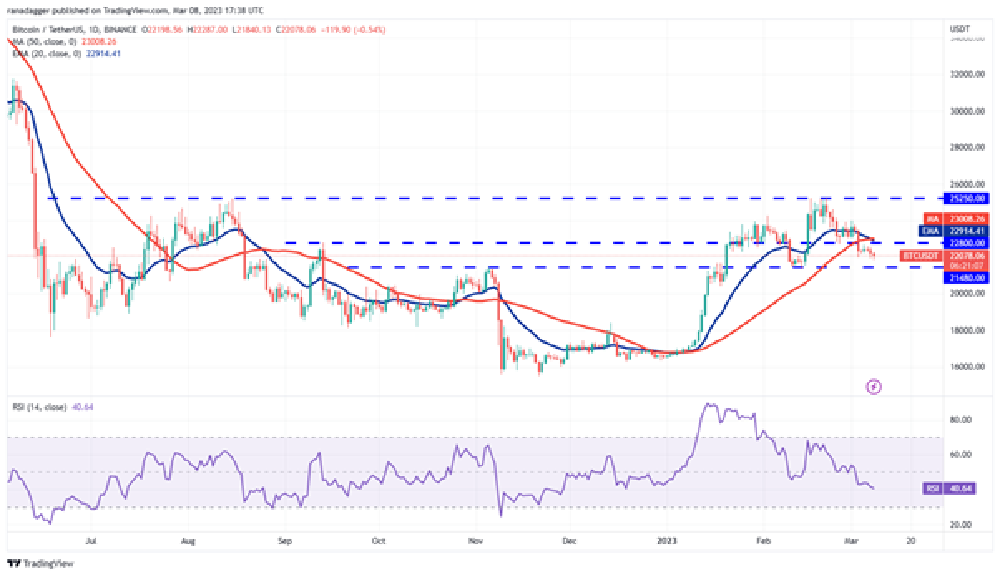
Should the price fall below $21,480, the bears may take advantage and aim to bring the price down to the significant psychological level of $20,000. It is expected that buyers will strongly defend the area between $21,480 and $20,000 as a break below this level could result in significant selling.
To avoid a sharp decline, the bulls must act quickly to elevate the price back above the moving averages, which could signal a possible trading range between $21,480 and $25,250.
ETH/USDT
Bullish investors are attempting to defend the $1,550 level on Ether, but the lack of a significant rebound suggests that the bears are selling during each small recovery. The downward trend of the 20-day exponential moving average ($1,599) and the negative position of the RSI indicate that the bears have the advantage. If the $1, 550 support level is breached, the ETH/USDT pair may decrease to $1,461.
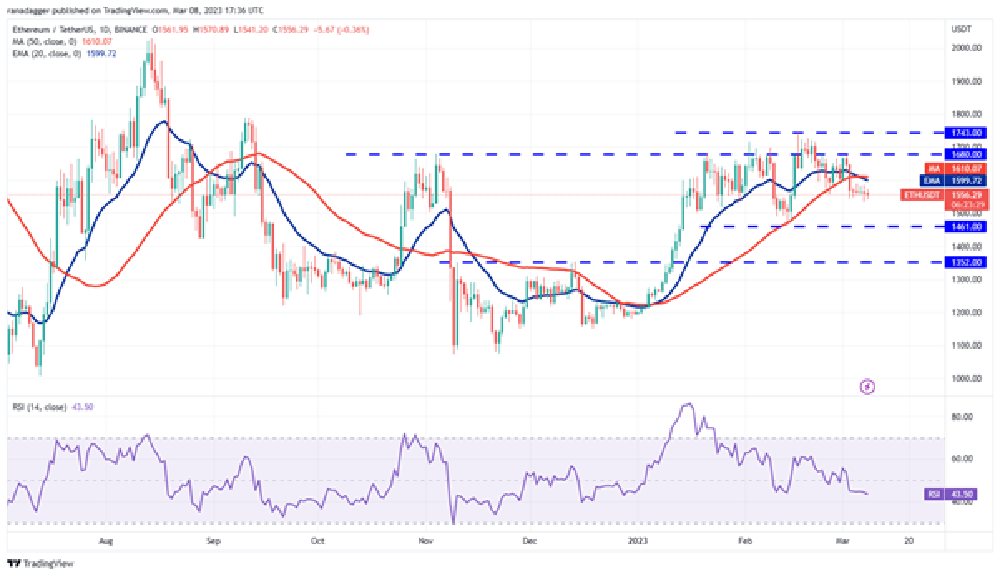
This level may draw in strong buying from the bulls. If the price bounces off this level with significant momentum, it could imply a period of consolidation between $1,461 and $1,743. Conversely, a break below $1,461 may lead to a potential decrease to $1,352, which may also attract strong buying from the bulls.
BNB/USDT
BNB bounced off the $280 support on March 6th and 7th, but the bears took advantage at higher levels, indicating that the sentiment remains negative and every minor recovery is being sold. If the $280 support fails, the BNB/USDT pair will form a bearish head and shoulders pattern, potentially leading to a decrease to $245 where buyers may attempt to halt the decline.
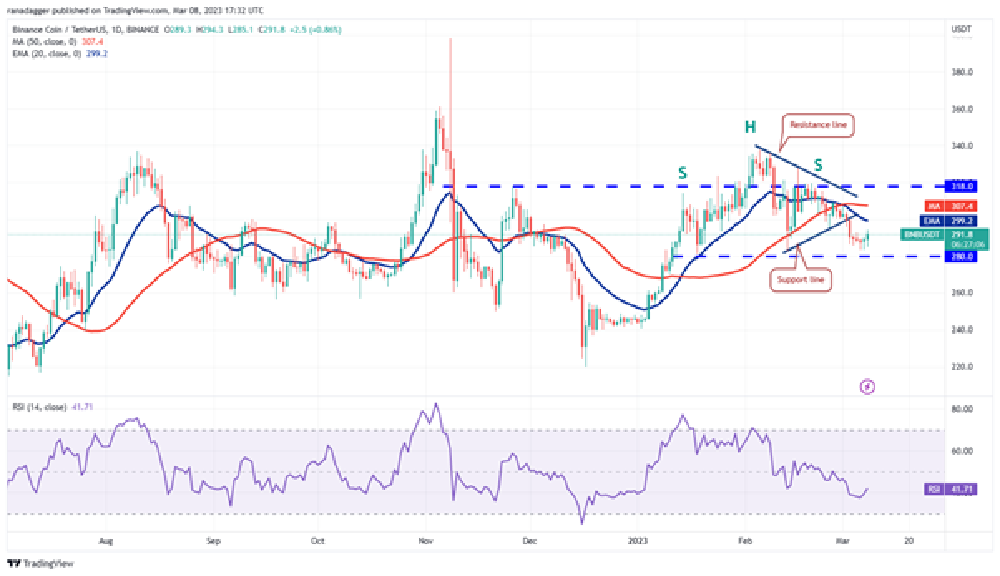
Alternatively, if the bulls sustain the current rebound, it would show that the buyers are strongly defending the $280 support, potentially leading to a recovery towards the 20-day EMA ($299).
The bears are likely to sell during the rally to the 20-day EMA. If this occurs, the pair may once again fall to $280. On the other hand, a break above the 20-day EMA would signal that the bears may be losing their grip.
XRP/USDT
XRP rebounded from the $0.36 support with significant momentum and broke through the descending channel’s resistance line on March 8th, a sign that the bulls are actively buying. If the buyers can maintain the price above the 50-day simple moving average ($0.39), it could indicate a potential change in trend in the short-term. The XRP/USDT pair may then aim for $0.43, where the bears are expected to put up strong resistance. If the price decreases from this level, the pair may remain in a range between $0.36 and $0.43.
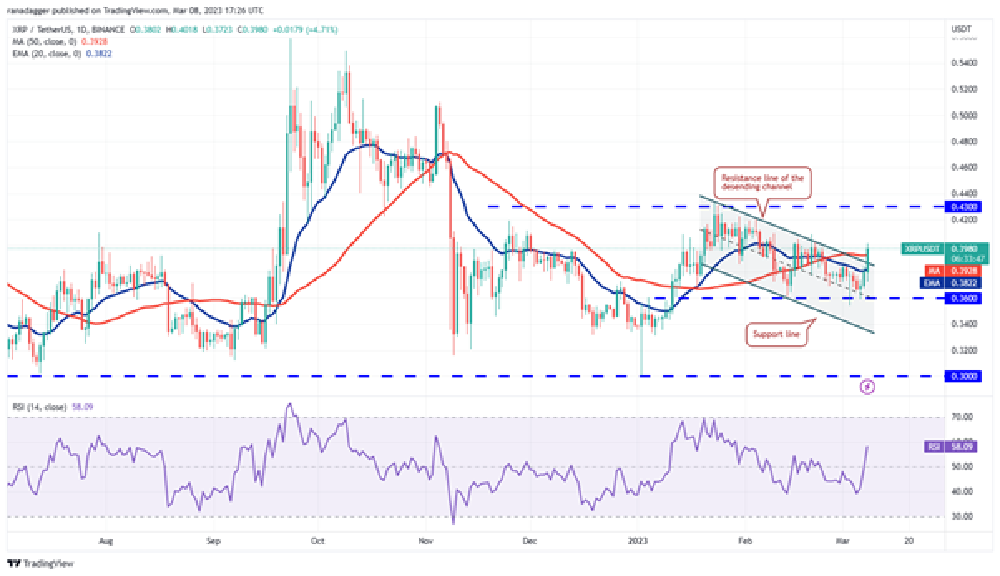
On the other hand, if the price decreases from its current level, it would suggest that the bears are not yielding to the bulls. The sellers may then attempt to bring the pair below $0.36, potentially leading to a drop to $0.33.
ADA/USDT
Cardano rebounded from $0.32 on March 7th, but the bulls were unable to maintain this momentum, indicating a lack of follow-up buying at higher levels. On March 8th, the bears are attempting to push the price below $0.32 again. If they succeed, there is another support level at the 61.8% Fibonacci retracement of $0.30.
If this support level is breached, the selling pressure may intensify, potentially causing the ADA/USDT pair to drop to the 78.6% Fibonacci retracement level of $0.27.
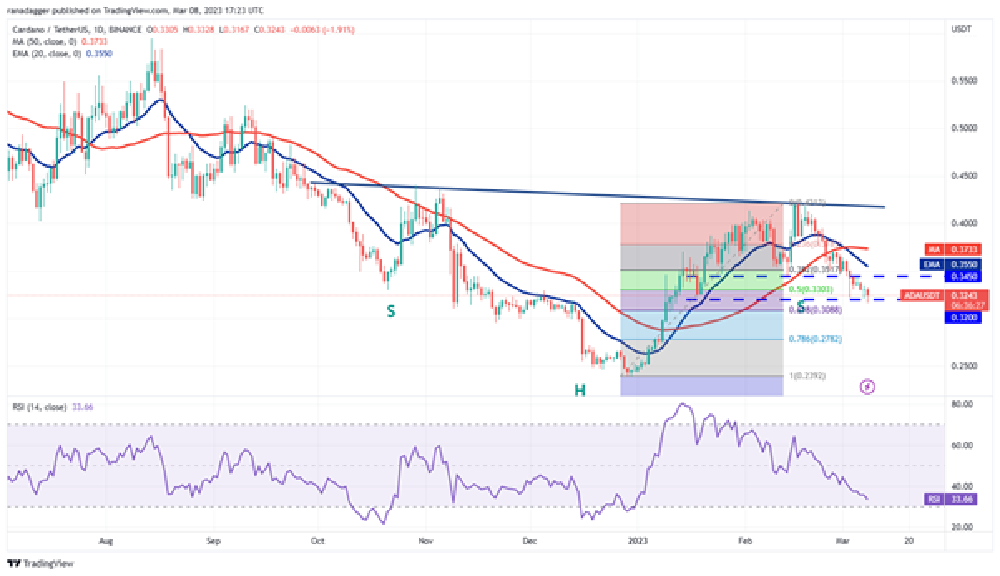
However, if the price rises from its current level or from $0.30, the pair may once again attempt a recovery. The bulls will have the advantage once they push the price above the moving averages.
DOGE/USDT
Dogecoin has been gradually decreasing towards the strong support near $0.07, but the presence of buying interest at lower levels, as indicated by the long tail on the March 6th and 7th candlesticks, is a minor positive. The bulls are attempting to drive the price towards the $0.08 breakdown level, which is likely to draw strong selling from the bears. If the price decreases from $0.08, the DOGE/USDT pair may drop to $0.07 and remain confined between these two levels for some time.
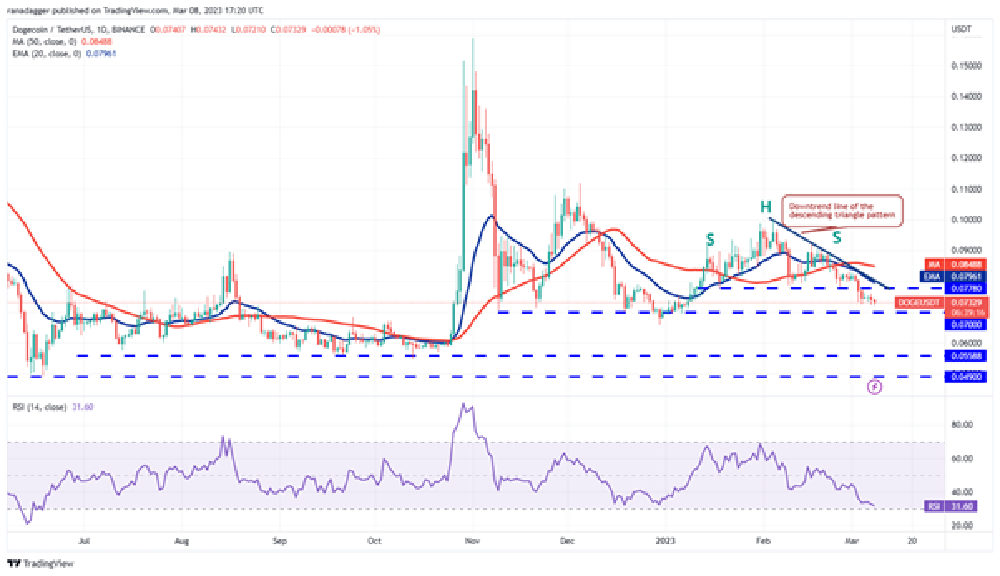
Breaking the support near $0.07 may prove challenging for the bears, but if they succeed, the pair could decrease to the next significant support near $0.06. On the positive side, a break and close above the downtrend line may signal the beginning of a potential recovery towards $0.10.
MATIC/USDT
Polygon has been trading within a narrow range for the past several days, which resolved to the downside on March 8th. The inability to initiate a recovery suggests that the bulls may be cautious about buying at current levels. The MATIC/USDT pair may decrease to the strong support at $1.05, where the bulls will attempt to defend the level. If the price bounces off this support, the pair may retrace to the moving averages.
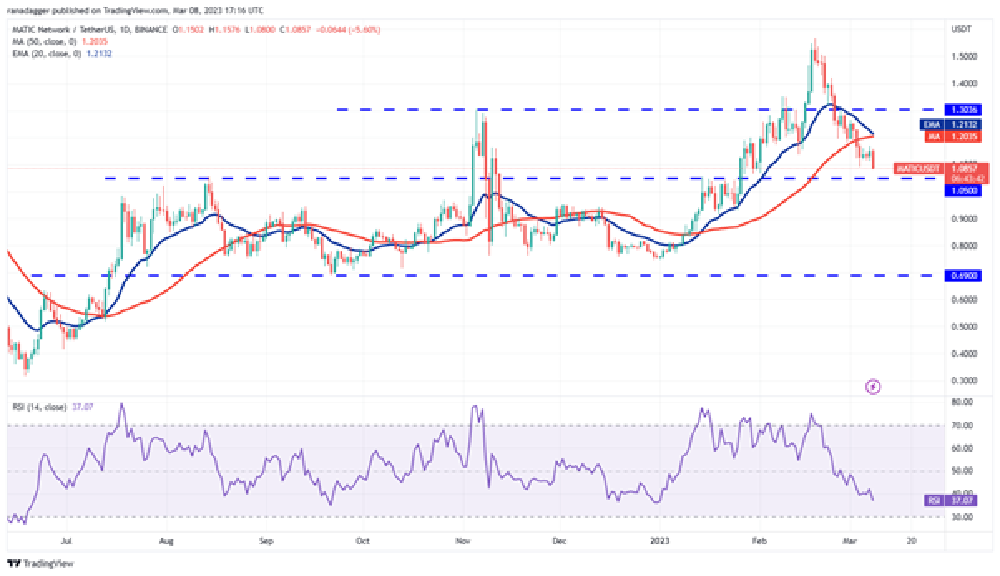
This is a crucial level to monitor as a break and close above it may indicate that the correction has ended. The pair may not immediately start a new upward movement, but instead, may remain in a range-bound pattern for a few days.
Alternatively, if the price decreases from the moving averages, it would indicate that the bears are continuing to sell during rallies. The bears may then attempt to bring the price below $1.05 again. If they succeed, the pair may decrease to $0.90.
SOL/USDT
Solana remains under firm bearish control. The inability to initiate a rebound from the crucial support at $19.68 suggests that buyers may not be eager to enter the market. On March 8th, the bears pulled the price below $19.68, signaling the start of the next stage of the correction. The bears may aim to further strengthen their position by bringing the SOL/USDT pair towards the next significant support near $15.
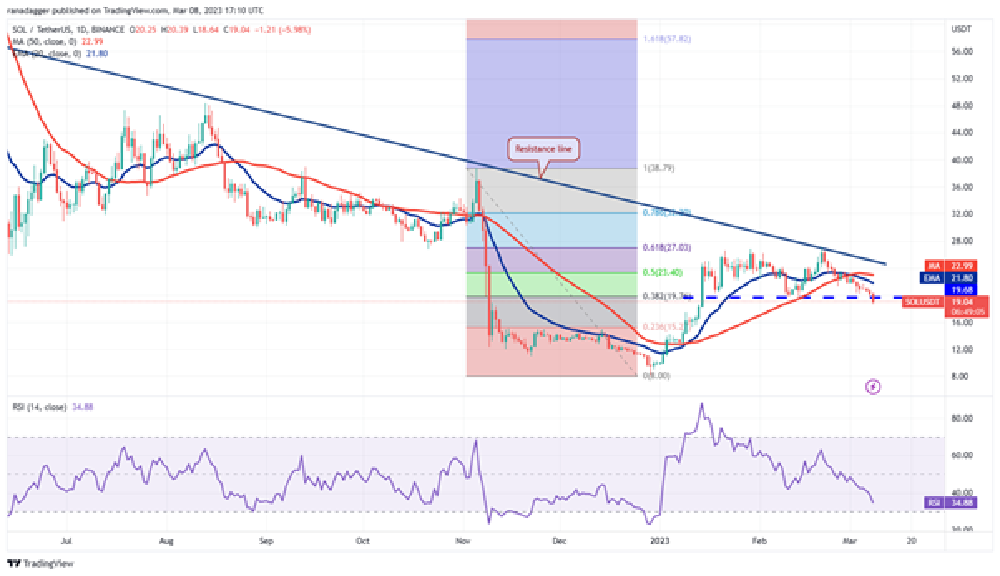
To prevent this decline, the bulls must act quickly to raise the price back above the 20-day EMA ($21.80). This may trigger a relief rally towards the resistance line, where the bears may again present a formidable challenge.
DOT/USDT
Polkadot declined and fell below the support at $5.73 on March 8th, indicating that the bears are seeking to further strengthen their position.
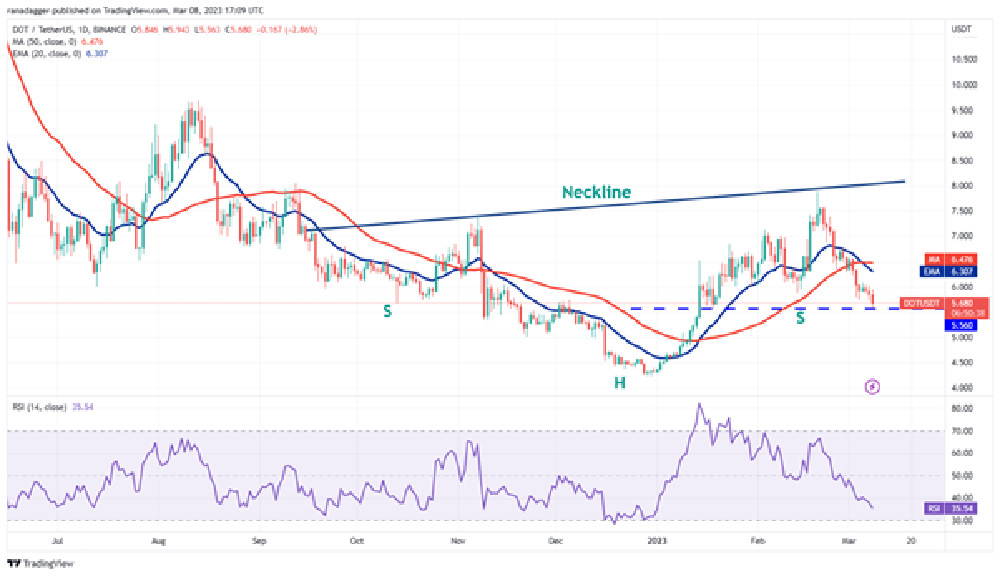
There is a strong support at $5.56, but if this level fails, the DOT/USDT pair may experience a sharp decline. The next support level is much lower at $4.80.
However, if the price bounces off $5.56, the pair may reach the 20-day EMA ($6.30). During downtrends, the bears tend to sell on rallies towards the 20-day EMA. If the price decreases from this level, the possibility of breaking below $5.56 increases.
For the bulls to make their presence known, they must drive the price above the moving averages.
LTC/USDT
Litecoin declined and fell below the immediate support of $85 on March 7th, signaling the continuation of the correction.
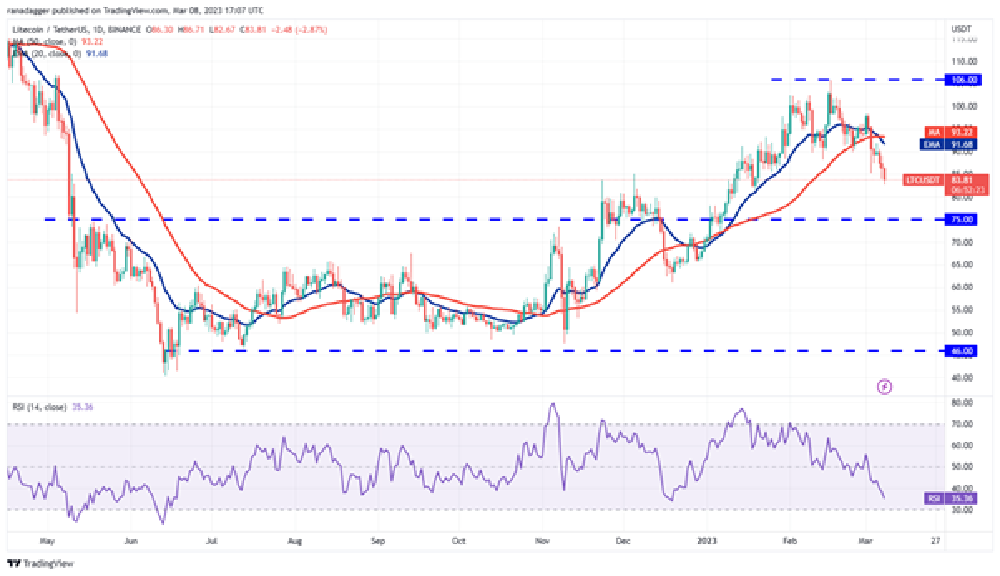
The LTC/USDT pair may first drop to the $81 support level. A bounce from this level may encounter selling pressure near the 20-day EMA ($92). If the price decreases from the 20-day EMA, the next target could be the crucial support at $75, which is likely to attract substantial buying from the bulls.
The more the price moves away from the local peak of $106, the longer it will take for the pair to resume its upward trend. The recovery is expected to gain momentum once the price remains above the moving averages.
- Source: https://cointelegraph.com
Top news


Comments
Subscribe
Login
0 Comments
Oldest