

If Bitcoin price breaks above $30,000, several altcoins such as SOL, ATOM, ICP and HBAR are well-positioned for a rally of their own.

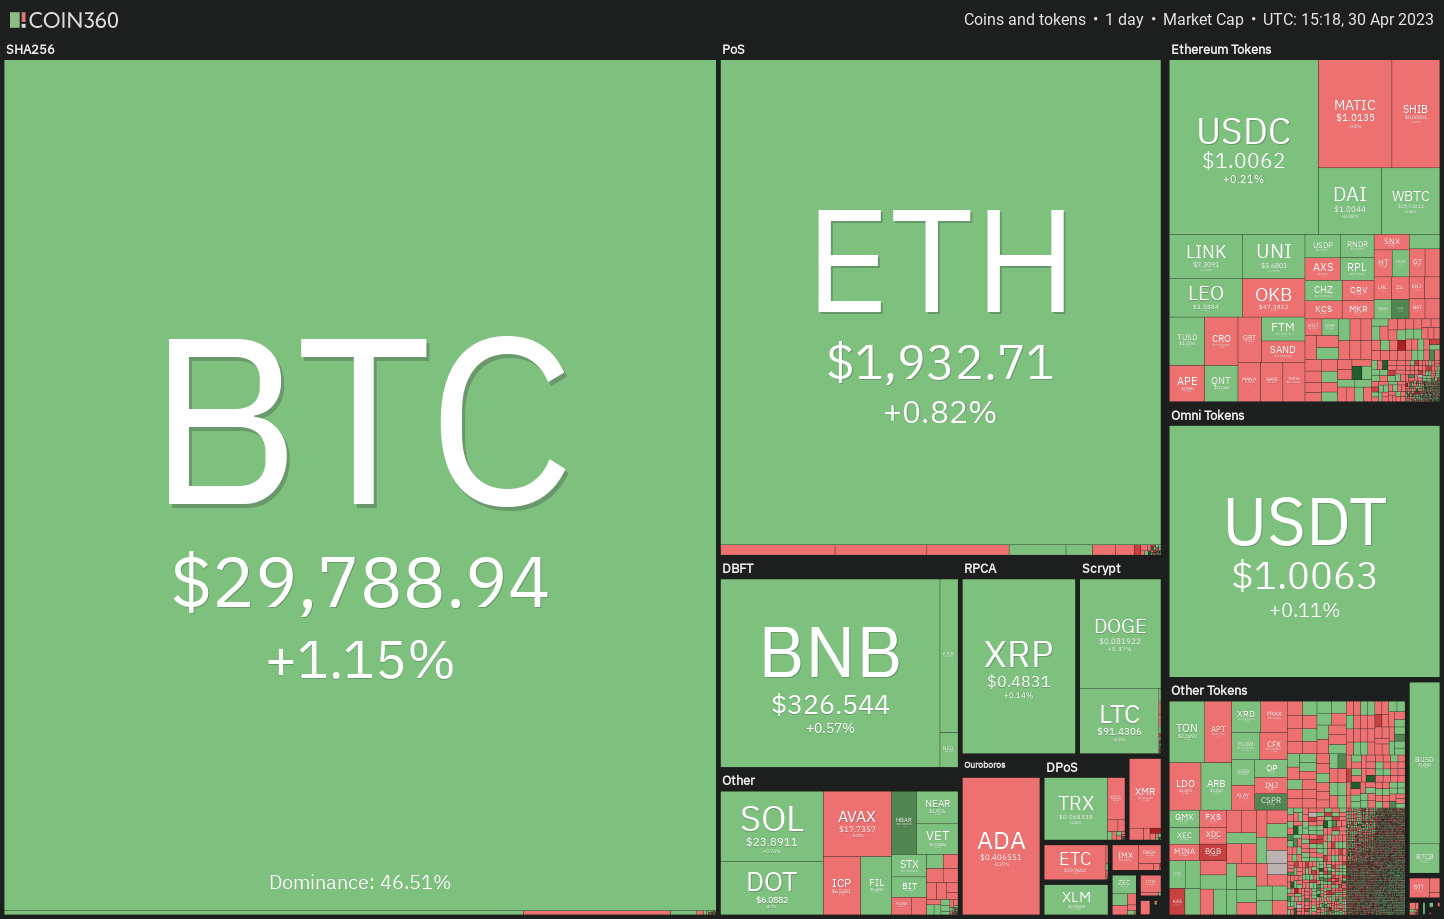
April saw a modest upward trend in high-risk assets, with the S&P 500 Index experiencing around a 1.5% increase, while Bitcoin is set to conclude the month with a gain exceeding 4%. Will this upward momentum persist into May, or is a pullback on the horizon?
The ongoing recovery may encounter obstacles if the banking issues in the United States worsen. In a Bloomberg interview, JPMorgan Asset Management CIO Bob Michele suggested that the unrest at First Republic Bank may not be an isolated incident and could potentially trigger a ripple effect.
Should this scenario unfold, the U.S. equity markets could undergo a correction. Predicting Bitcoin’s response to such a crisis is challenging, as its price has risen in recent days despite the deepening troubles within traditional banking. However, if the U.S. banking sector experiences significant turmoil, Bitcoin may eventually face a correction as well.
In the short term, both Bitcoin and select altcoins are demonstrating resilience. We’ll analyze the charts of five cryptocurrencies that have the potential to outperform in the days ahead.
Bitcoin price analysis
Following a two-day period of minimal price fluctuations in Bitcoin, the bulls are attempting to establish dominance on April 30th.
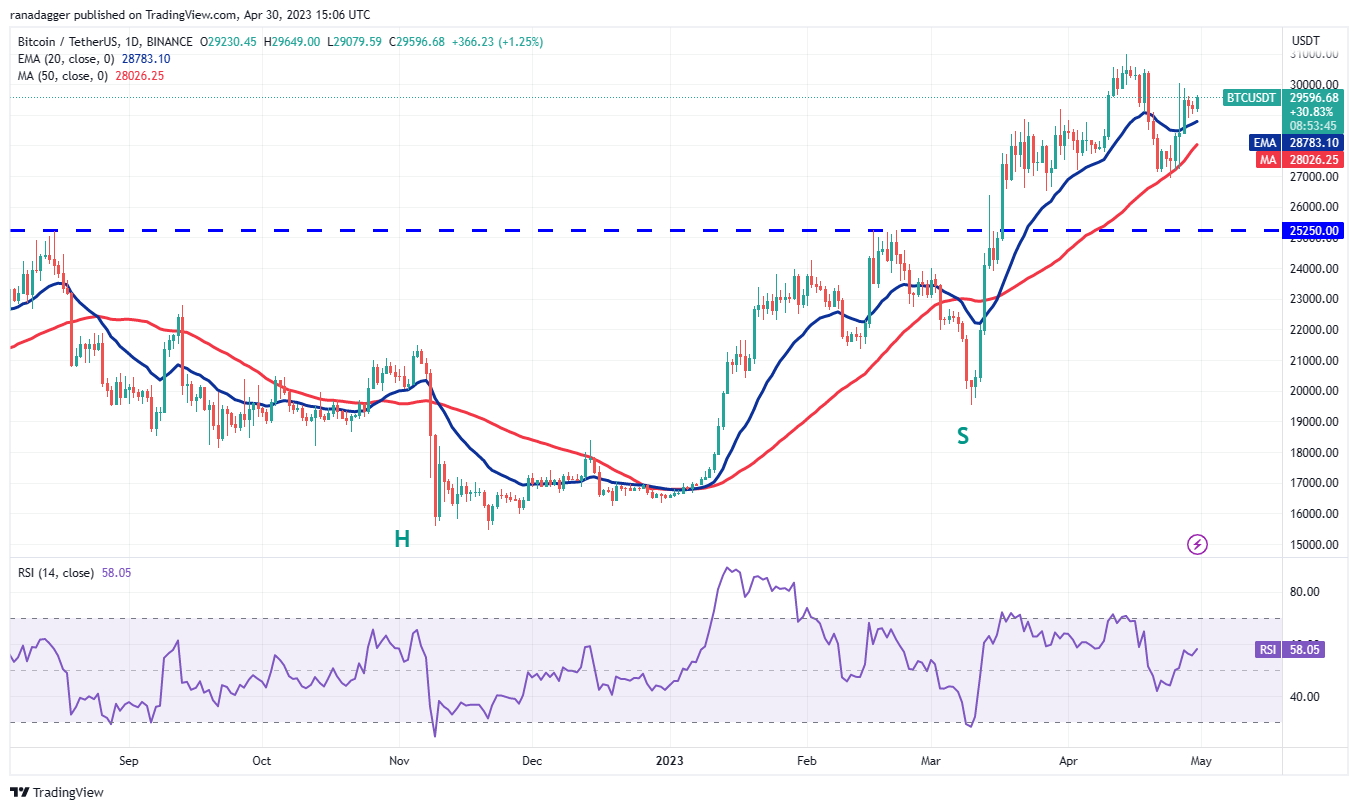
The 20-day exponential moving average (EMA) at $28,783 has gradually begun to rise, and the relative strength index (RSI) is in the positive territory, suggesting that the path with the least resistance lies upward.
Should the bulls manage to push Bitcoin’s price above $30,000, the BTC/USDT pair could potentially ascend towards the overhead resistance zone ranging from $31,000 to $32,400. Though buyers might encounter significant resistance in this area, overcoming it could propel the pair towards $40,000.
It is crucial to monitor the 50-day simple moving average (SMA) at $28,026, which serves as a key support level. If the BTC price plunges below this point, bears may seize the opportunity and attempt to pull the pair down to $25,250.
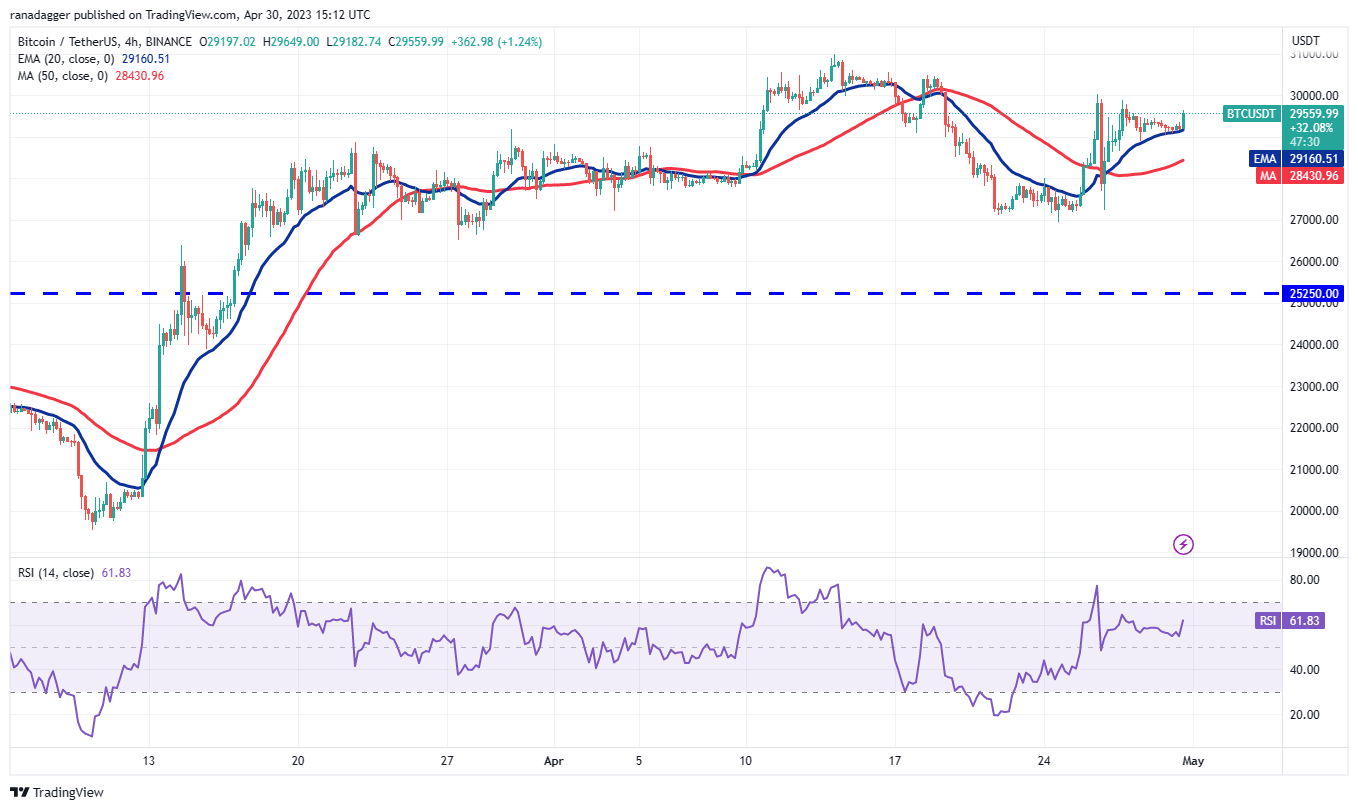
The bears made an attempt to pull the pair below the 20-EMA, but the bulls maintained their stance. This could have enticed further buying, and the bulls will now aim to push the price above $30,000. If successful, Bitcoin could climb to $30,500 or even $31,000.
On the other hand, if the price declines and breaches the 20-EMA, it would imply that bears are selling near the overhead resistance levels. In this case, the pair could drop to the 50-SMA.
Although the bulls will strive to defend this level, if the bears gain the upper hand, the next target is likely to be $27,000. Buyers are expected to vigorously guard the range between $27,000 and $25,250.
Solana price analysis
The bulls successfully prevented Solana from falling below the downtrend line in the latest corrective phase, which suggests that there is demand at lower price levels.
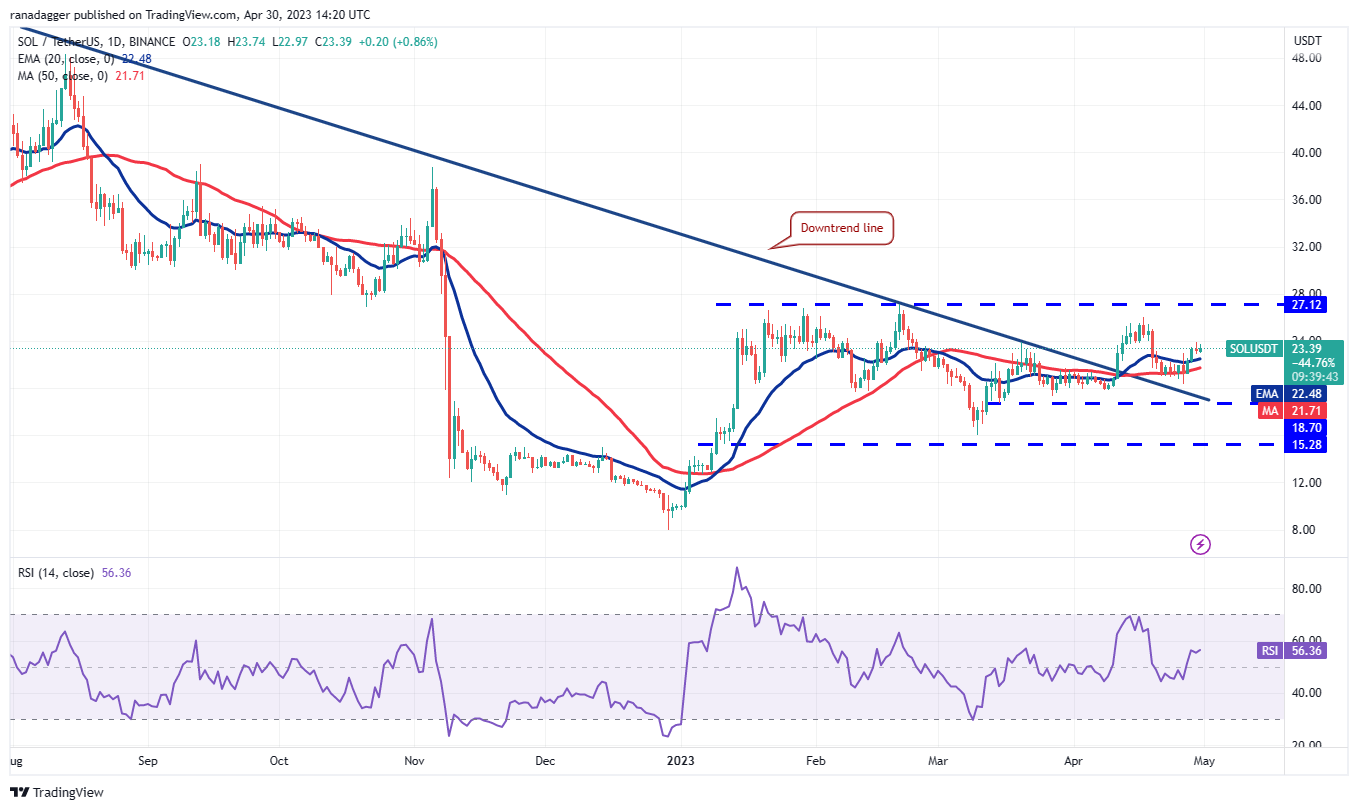
Next, buyers will attempt to drive the price towards the overhead resistance at $27.12. This level is crucial to monitor in the short term, as a successful push above it could result in the SOL/USDT pair rapidly advancing towards $39.
The bullish outlook may be invalidated in the short term if the price declines and breaches the moving averages. In that case, the pair could potentially drop to the critical support level at $18.70. Should the price rebound from this point, it would indicate that the pair might fluctuate within the broad range between $18.70 and $27.12 for an extended period.
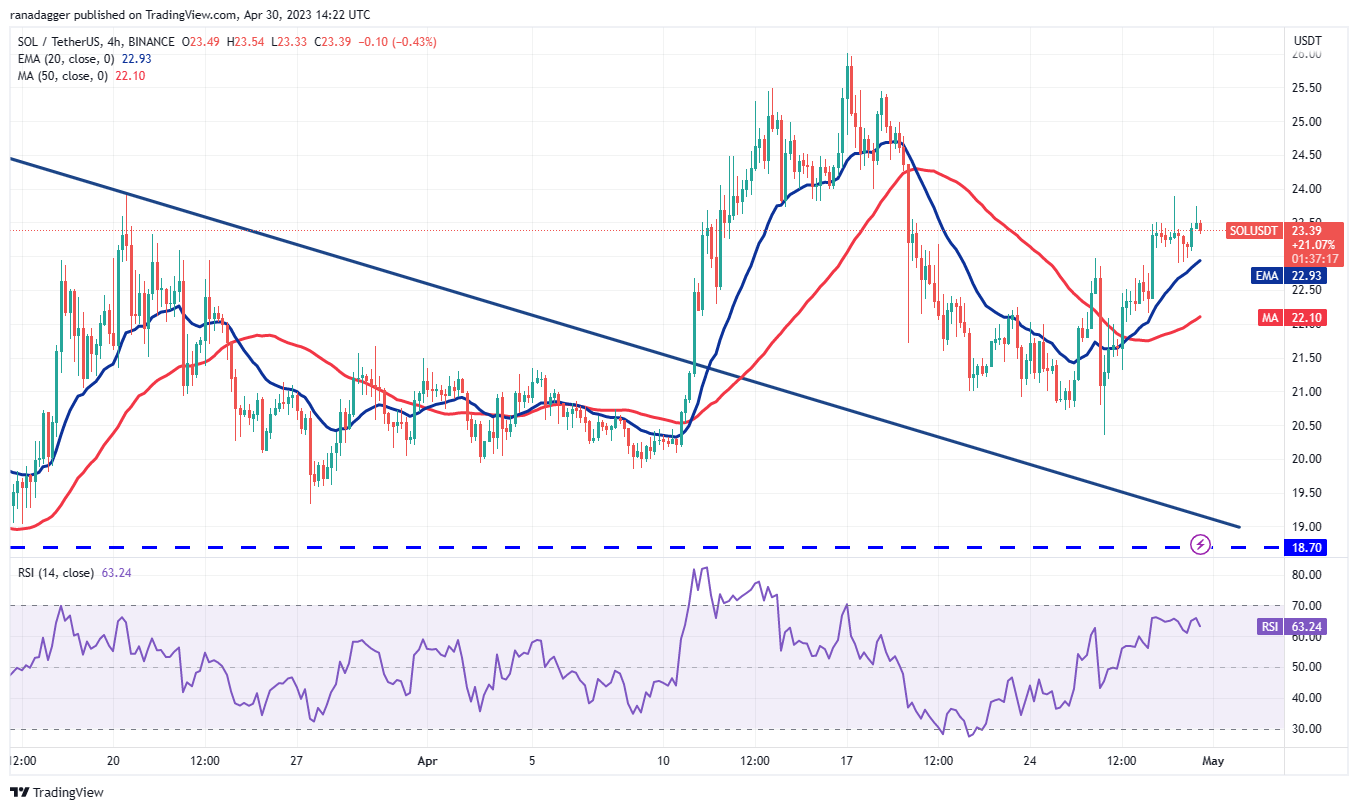
On the 4-hour chart, the moving averages have begun to rise, and the RSI is in positive territory, signaling that buyers currently have the upper hand. The bears are attempting to hinder the recovery at $24, but if the bulls surpass this obstacle, the pair could gain momentum and surge towards $25.50.
To thwart the rally, bears need to promptly pull the price back below the 20-EMA. In case the price starts to decline, the 50-SMA will be the support level to keep an eye on.
Cosmos price analysis
The long tail on Cosmos’ April 26 candlestick indicates that the bulls are vigorously protecting the support level at $10.20.
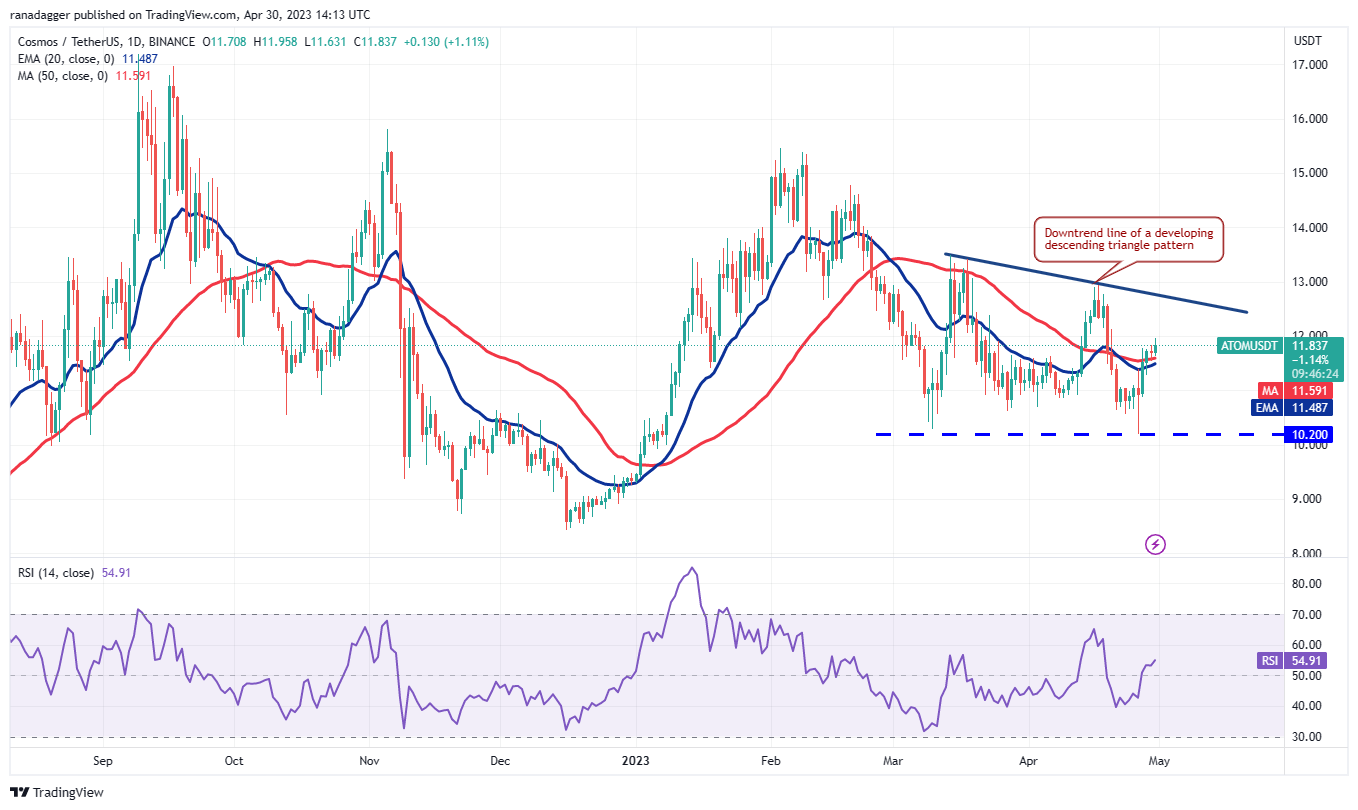
Buyers have driven the price above the moving averages and will now attempt to approach the downtrend line. This is a critical level to monitor, as a break and close above it could pave the way for a potential rally to $13.50 and subsequently to $15.50.
Conversely, if the ATOM/USDT pair reverses its course at the downtrend line, it would imply that bears are aiming to create a descending triangle pattern. A drop below the moving averages could then lead to a possible retest of the $10.20 support level.
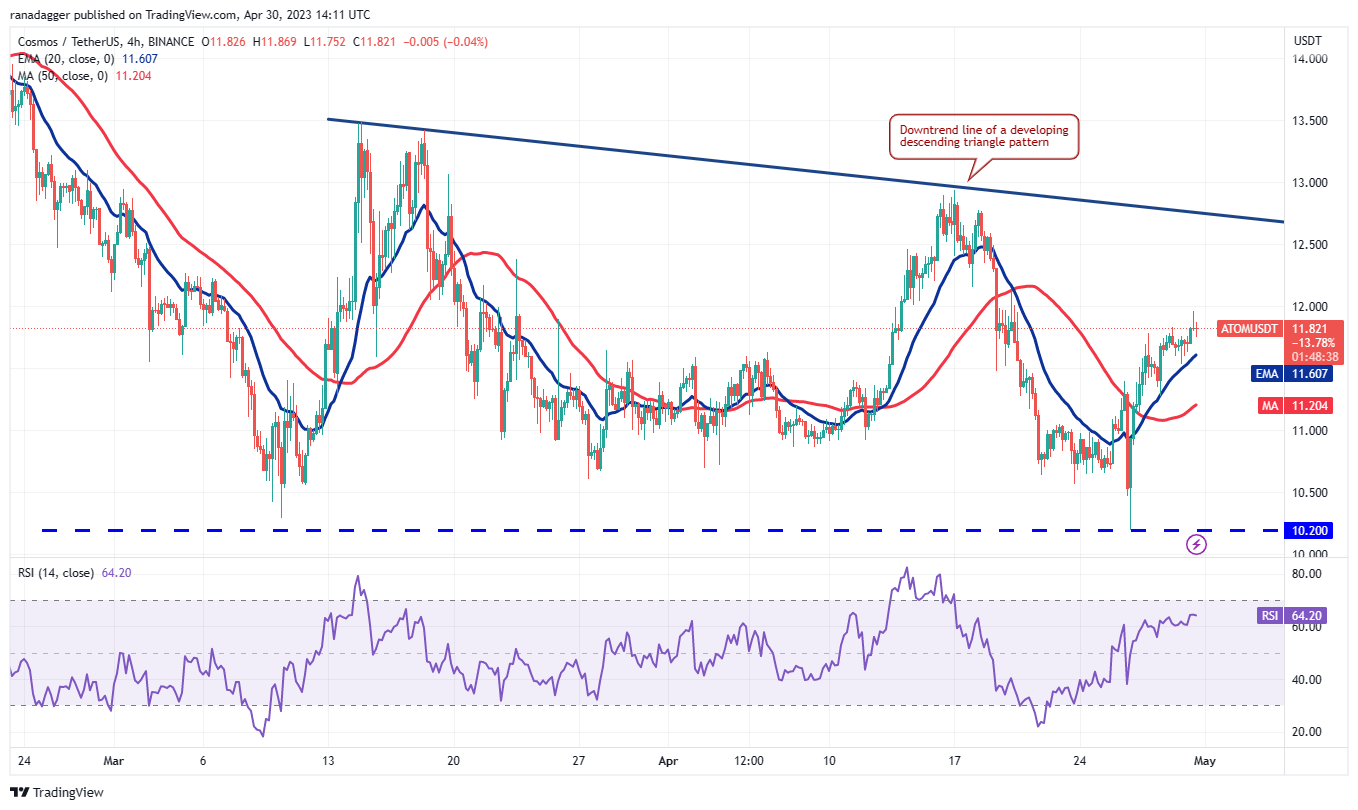
The 20-EMA on the 4-hour chart has risen, and the RSI is approaching the overbought territory, suggesting that the bulls hold the reins. There is a minor obstacle at $12.13, but it is likely to be overcome, potentially allowing the ATOM price to rise and test the downtrend line.
However, if the price reverses from $12.13, bears will once again attempt to pull the pair below the 20-EMA. Should they succeed, it would imply that buyers might be losing their grasp, and the pair could then be at risk of sliding to the 50-SMA.
Internet Computer price analysis
Internet Computer fell below the 50-day SMA ($5.38) on April 26, but this turned out to be a bear trap. The price rebounded on April 27 and initiated a robust recovery.
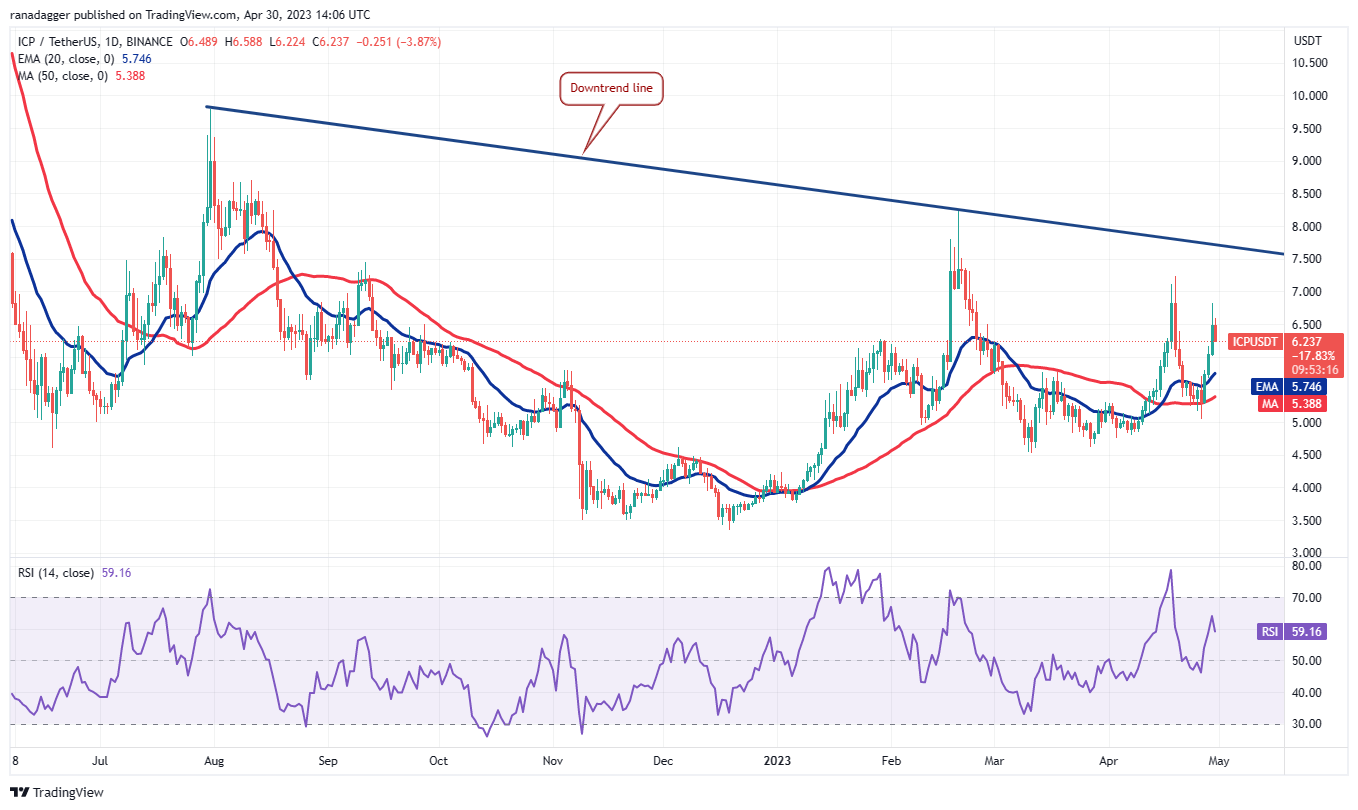
The 20-day EMA ($5.74) has begun to rise, and the RSI has entered the positive zone, suggesting that the bulls have a slight advantage. If the price remains relatively stable at the current level or bounces off the 20-day EMA, it would indicate that bulls are purchasing during the dips.
This would increase the likelihood of a rally towards the downtrend line, where bears are expected to mount a vigorous defense. Conversely, a break below the 50-day SMA would shift the balance in favor of the bears.
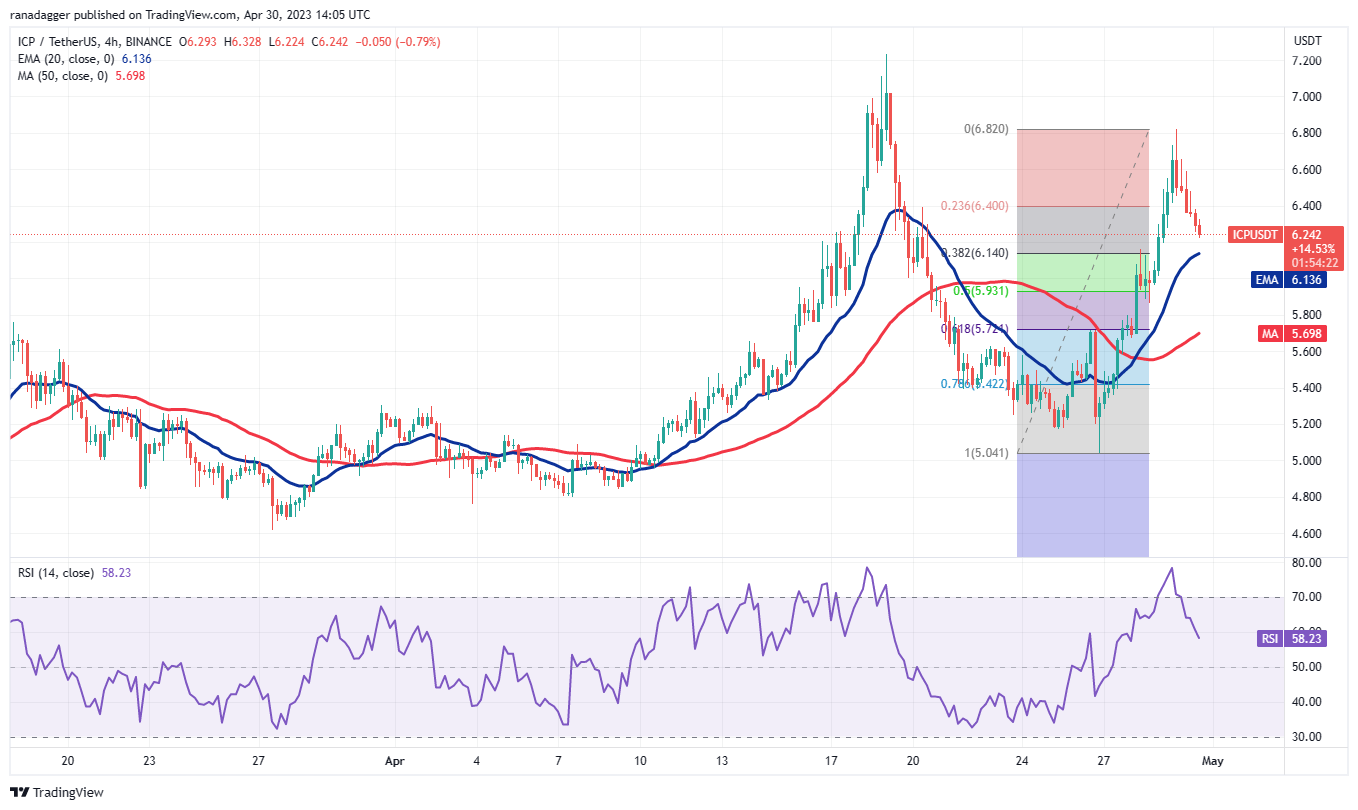
The 4-hour chart reveals that the ICP/USDT pair is currently in a corrective phase. The initial support lies at the 20-EMA, which is close to the 38.2% Fibonacci retracement level at $6.14. If the price rebounds from this support, the pair might rally to $7.23 and eventually reach $7.70.
Contrary to this scenario, if the price continues to decline and breaks below the 20-EMA, it would suggest that short-term bulls might be taking profits. This could drag the price towards the 50-SMA, which is near the 61.8% retracement level at $5.72.
Hedera price analysis
The bears persistently attempted to pull Hedera below $0.06, but the bulls stood firm. The inability to breach the support level drew in buyers, who will now try to drive the price above the downtrend line.
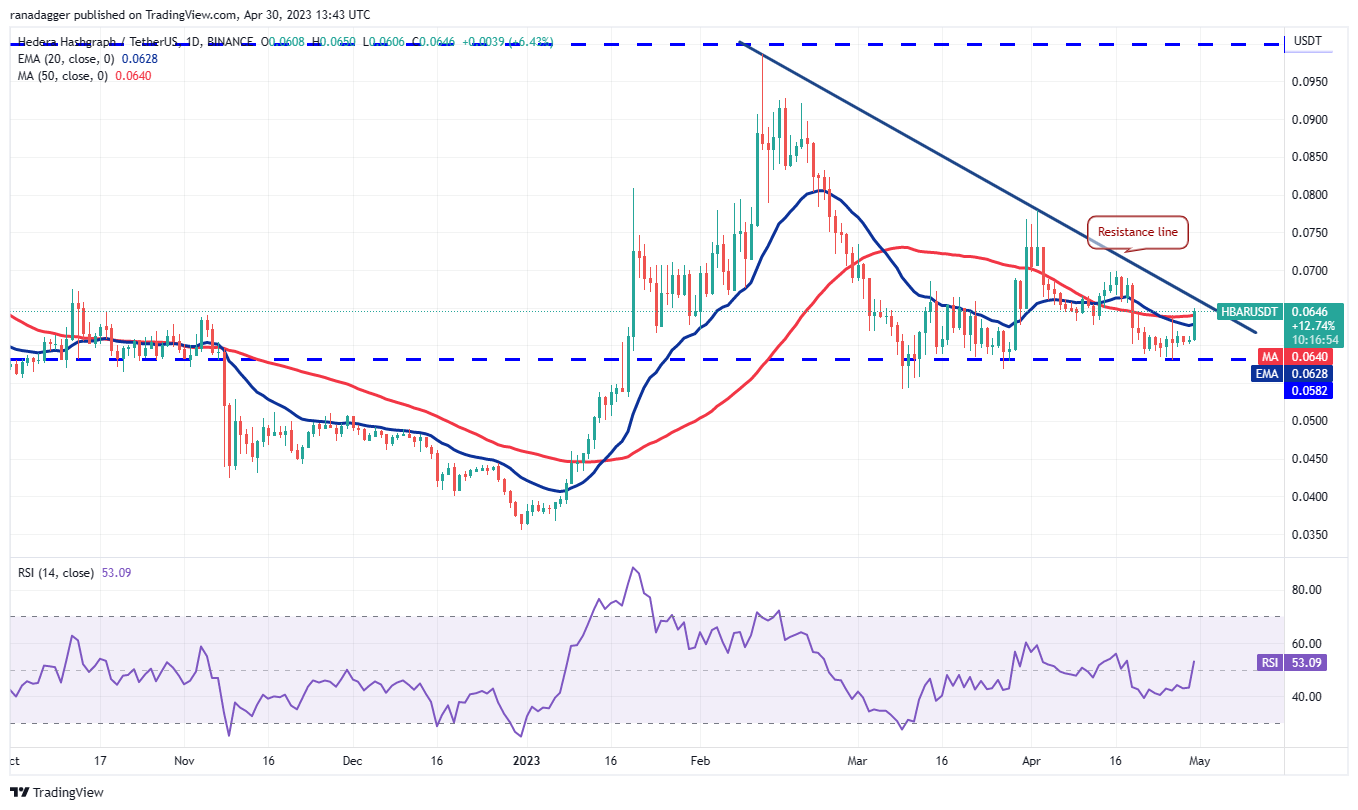
The 20-day EMA ($0.06) is leveling off, and the RSI has risen above the midpoint, suggesting that selling pressure is decreasing. If buyers propel the price above the resistance line, the bullish momentum may intensify, and the HBAR/USDT pair could advance towards the overhead resistance at $0.08.
On the other hand, if the price reverses from the current level or the resistance line, it would imply that bears continue to be active at higher price points. This would raise the likelihood of a break below $0.06.
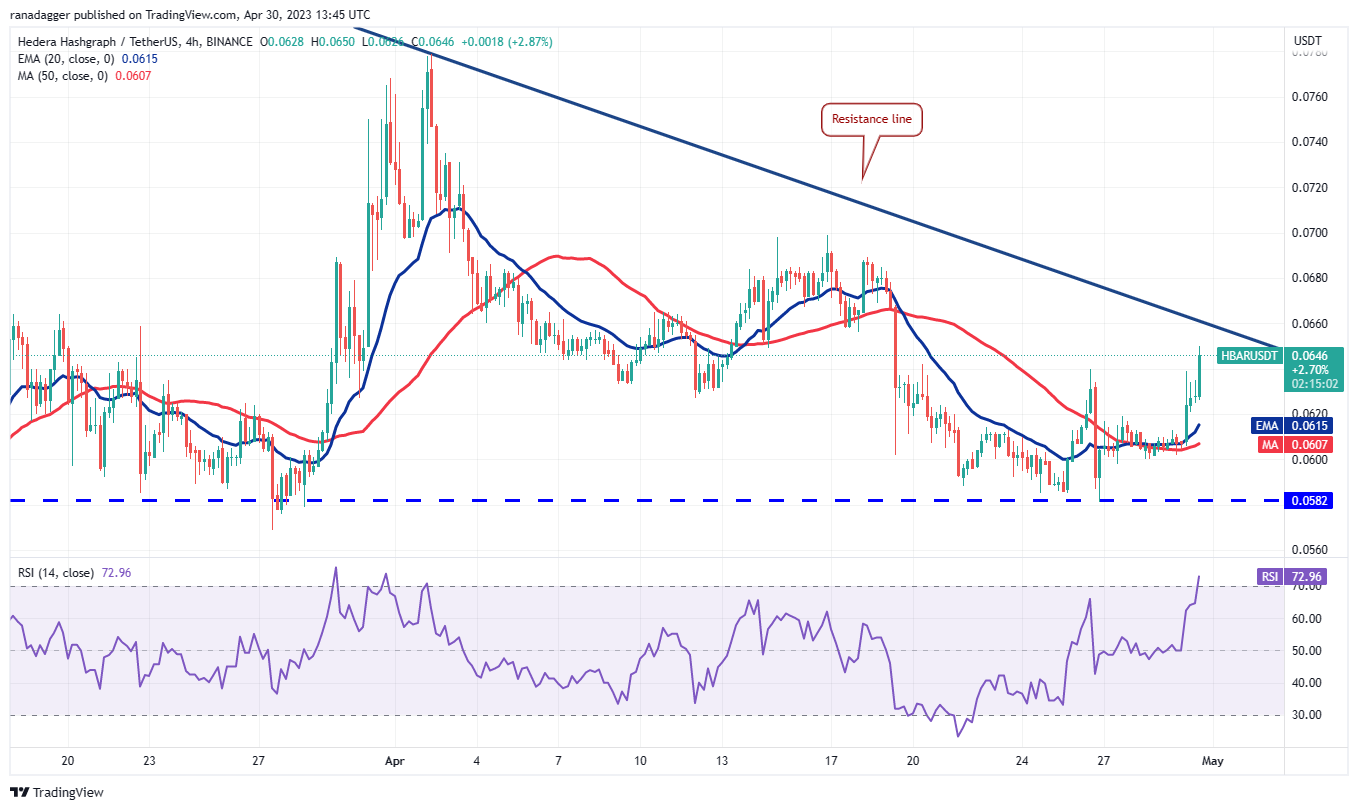
The 4-hour chart demonstrates that the bulls have turned the moving averages into support and initiated an upward movement likely to reach the resistance line. This level is anticipated to act as strong resistance, but on the decline, if the pair bounces off the 20-EMA, it would indicate a sentiment shift from selling on rallies to buying on dips.
The pair could then break above the resistance line and begin its ascent towards $0.07 and eventually $0.08. To regain control, the bears will need to swiftly drag the HBAR price below the moving averages.
Top news


Comments
Subscribe
Login
0 Comments
Oldest