The upgraded crypto intelligence dashboard now features tools utilized by more than 100 of the top crypto organizations globally, with enhanced capabilities.
- Cointelegraph Markets Pro 2.0 — What’s new?
- An updated news section
- Top VORTECS™ Scores
- Top 5 Exchange Inflows and Outflows
- Most Active On-Chain 24hr
- Net New Developers by Layer 1 Ecosystem in the last 30 days
- Total Value Locked (TVL) Gainers
- Season Indicator
- Join the Cointelegraph Markets Pro trading community
Cointelegraph Markets Pro is a comprehensive, institutional-level crypto market intelligence solution that provides traders of all levels with real-time alerts for potential price changes, allowing for quick and informed decisions.
The goal behind the creation of Cointelegraph Markets Pro was to bridge the gap between institutional and retail investors. To accomplish this, the platform offers unique tools like the Newsquakes™ indicator, the VORTECS™ Score, and the Tweet Sentiment indicator.
An examination of Cointelegraph Markets Pro’s alert performance reveals its outstanding success as an institutional-level platform. Since 2021, the platform has consistently generated an average return of:
- Score-based trading strategies using the platform have produced gains of 2,895%, potentially transforming a $10,000 investment into $289,549.
- Time-based trading strategies have generated gains of 546%, potentially resulting in $54,635 from a $10,000 investment.
- Buy-and-hold breakout strategies have seen gains of 851%, potentially turning $10,000 into $85,179.
Following two years of providing successful trade opportunities every week and considering feedback from thousands of users, the Cointelegraph Markets Pro team has implemented the most requested feature upgrades, as well as other improvements to enhance the platform even further.”
Cointelegraph Markets Pro 2.0 — What’s new?
The updated dashboard combines new features with a streamlined design that simplifies the process of receiving and analyzing information for traders. For instance, the dashboard has been divided into two sections: Short Term Trends and Long Term Trends, enabling traders to effortlessly switch between them based on their preferred trading style.
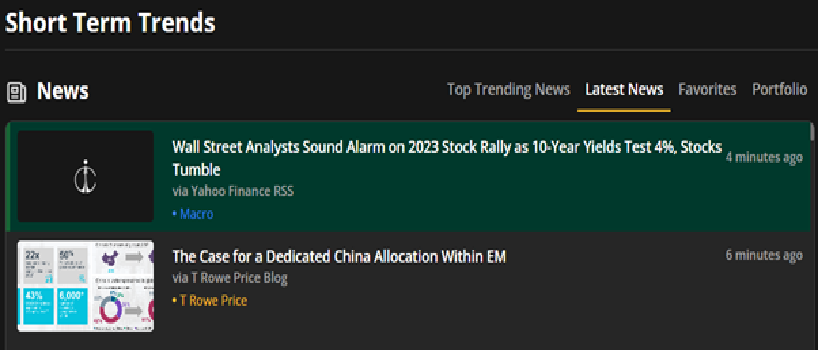
An updated news section
The news section now showcases the most popular trending news and the latest updates. The top trending news is determined by the frequency of tweets about the stories within a 24-hour period. Additionally, users can easily identify the news category by the red lettering beneath the title.
Top VORTECS™ Scores
The upgraded dashboard offers a more comprehensive view of the tokens with the highest VORTECS™ Scores. This numerical value reflects the asset’s current sentiment, Twitter activity, trading volume, and price movement in relation to its entire history. A higher score indicates that the current market conditions have a higher likelihood of being bullish for the asset within a 24-hour period.
Top 5 Exchange Inflows and Outflows
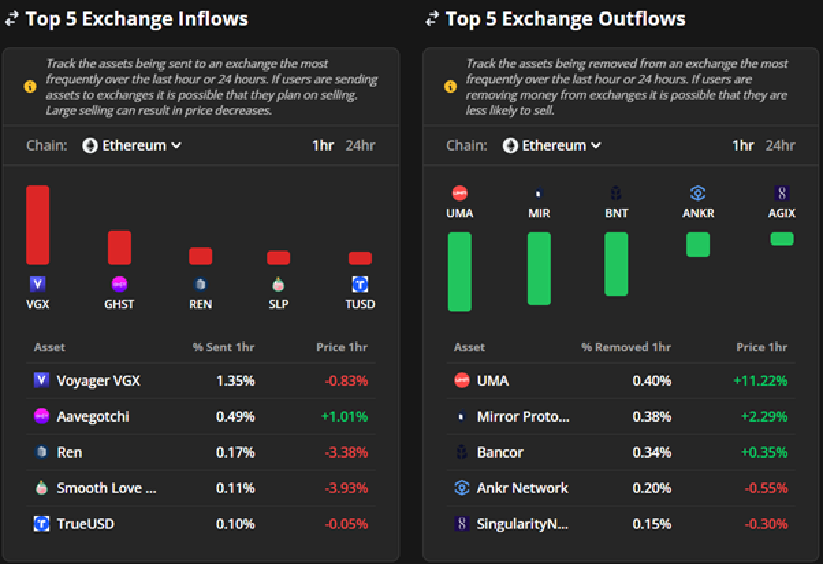
The Top 5 Exchange Outflow section highlights the assets that are being withdrawn from exchanges most frequently over a one-hour or 24-hour period. If investors are withdrawing their funds from exchanges, it could indicate their intention to hold the assets and reduce the likelihood of selling.
Moreover, users have the option to filter this information based on blockchain and time frame.
Most Active On-Chain 24hr
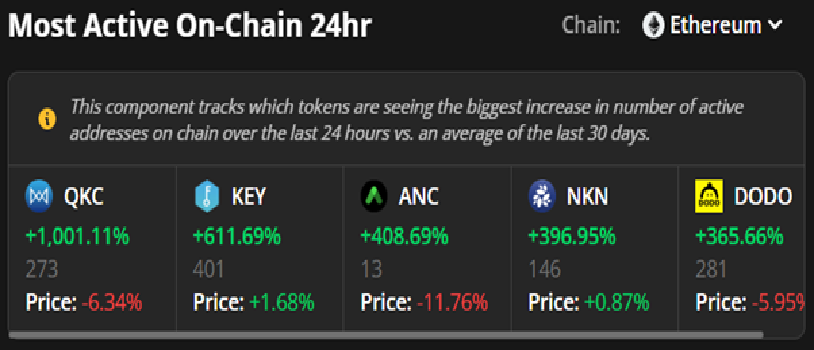
The upgraded Most Active On-Chain section displays the five tokens with the biggest rise in the number of active on-chain addresses in the past day compared to the average of the last 30 days.
Similar to the tweet and trade sections, these tokens are listed from highest to lowest, from left to right, and their price movement is shown at the bottom, below the number of addresses. An increase in on-chain activity is typically viewed as a bullish sign, indicating that the project is being widely adopted and more users are joining.
Net New Developers by Layer 1 Ecosystem in the last 30 days
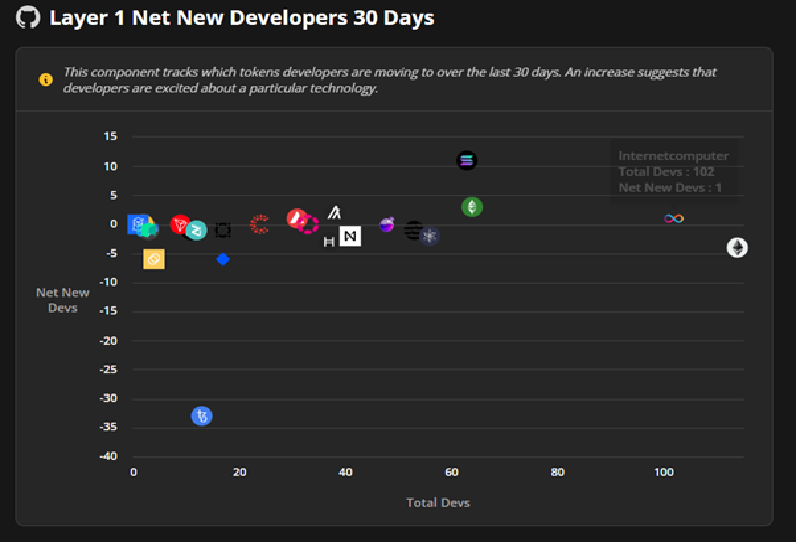
This section displays the tokens that developers have been transitioning to over the past 30 days. An increase in this activity indicates that developers have a strong interest in a particular technology. The success of a layer 1 technology is dependent on the applications built on it, so an increase in development on a layer 1 is considered a positive long-term sign.
Total Value Locked (TVL) Gainers
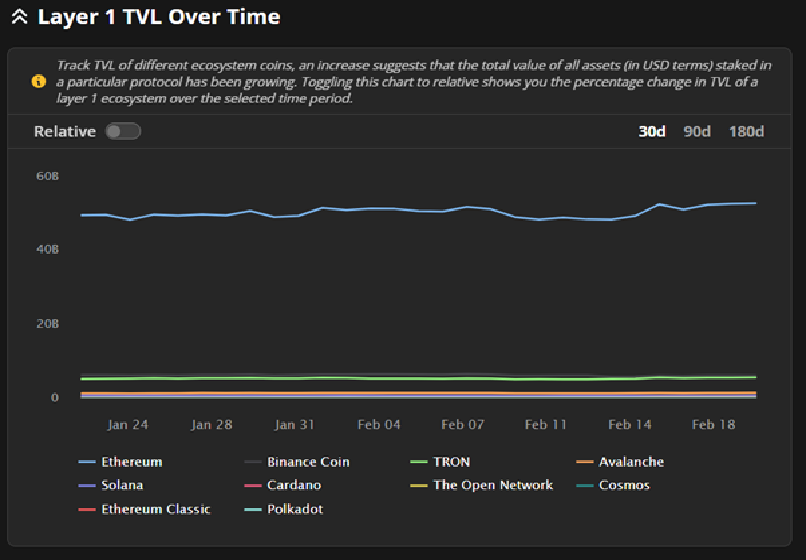
This chart enables users to monitor the total value locked (TVL) of various ecosystem tokens. A rise in TVL can indicate that the value of all assets staked in a protocol is increasing, which is generally viewed as a positive sign as it demonstrates interest and investment in a particular ecosystem.
Users have the option to view the percent changes by clicking the “Relative” button and filtering the data by time frame (30, 90 or 180 days). They can also choose to hide a specific blockchain by selecting its name in the drop-down menu below.
Season Indicator
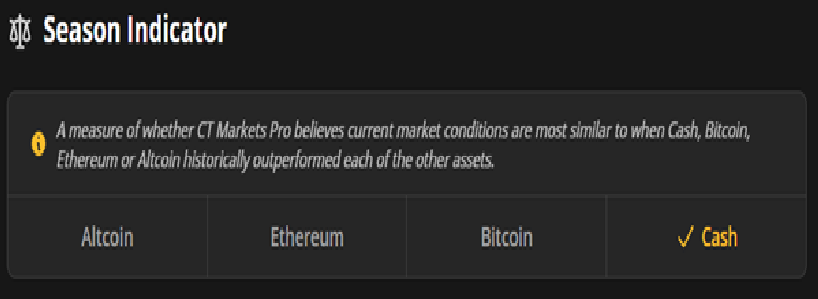
The Cointelegraph Markets Pro data provides a metric that indicates which of the four asset classes – cash, Bitcoin, Ether, or altcoins – has historically outperformed the other assets during specific seasons. This season indicator is based on reliable data and informs traders about the current market season.
Join the Cointelegraph Markets Pro trading community
The latest version of Cointelegraph Markets Pro combines institutional-level tools with a comprehensive library of information for independent analysis. By merging individual research with the recommendations of institutional tools, traders can consistently identify high-probability trades.
source: cointelegraph.com
